Executive Insights Power BI Template
The SysTrack Power BI Connector includes a pre-built template for Executive Insights, representing the Executive Insights dashboard in SysTrack.
Benefits
The preconfigured Power BI Executive Insights template brings you the following benefits :
-
Access more datasets: In addition to the datasets previously available through the Power BI Connector, you have access to three more datasets: Desktop Costs Impact, Server Costs Impact, and Community Health.
-
Give executives the data they want: Executives who do not frequently check dashboards in SysTrack can view the Executive Insights dashboard data on their Power BI dashboard, which is more familiar to them. Power BI integrates data from multiple sources to streamline analysis and enable quicker, more effective decision-making for executives.
-
Shrink the learning curve: Power BI can be difficult to configure and use for beginners and intermediate users. After an administrator sets up the Power BI Connector, the preconfigured Executive Insights template is ready to go, so that novice users can use it immediately. The preconfigured template has helpful visualizations already built in.
-
Understand the calculations: Users who want more insight on how SysTrack calculates health scores, productivity impact, impacted health breakdown, and costs can access the Power Query in Power BI to understand which data affects the scores. By having access to the Power Query, advanced users can modify it to fit their needs.
Install the Template
To get the Power BI Executive Insights template, follow the steps to install the Power BI Connector. When you download the .pqx file, you will also download the .pbit file in the same way. The .pbit file is the Executive Insights template.
After you install the connector and download the .pbit file, follow these steps:
-
In the folder where you downloaded the .pbit file, double-click the file.
-
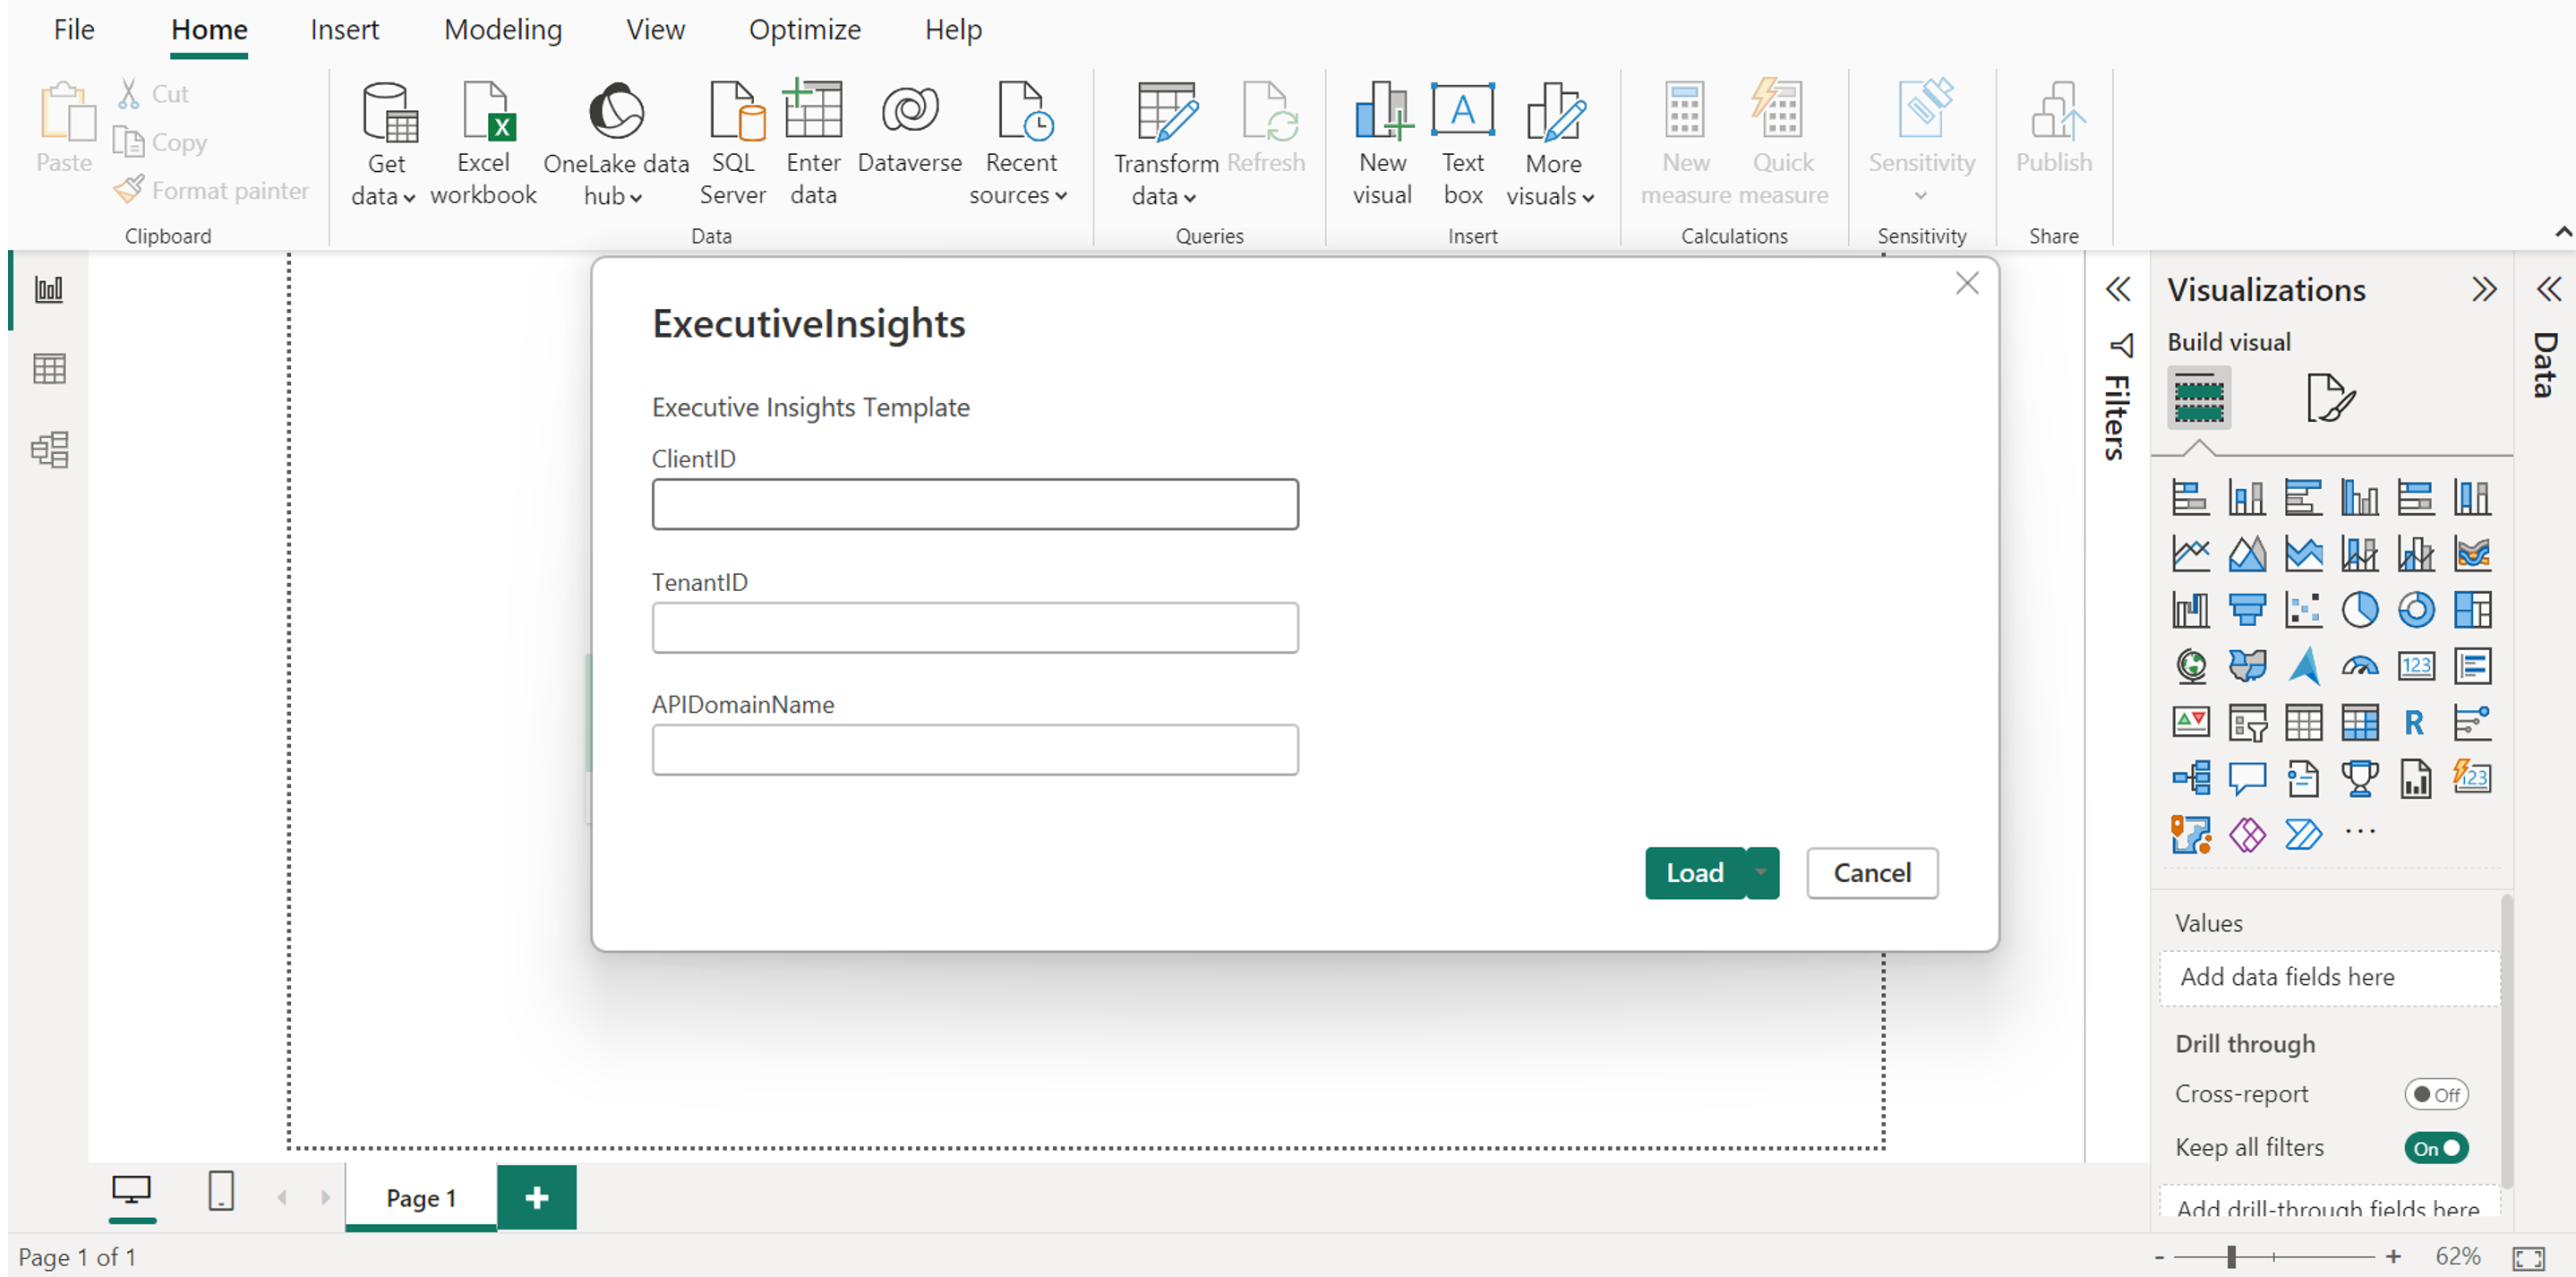
The template opens, and it first displays the ExecutiveInsights dialog box.
-
In the ExecutiveInsights dialog box, enter your SysTrack ClientID, TenantID, and APIDomainName. Then click Load.
-
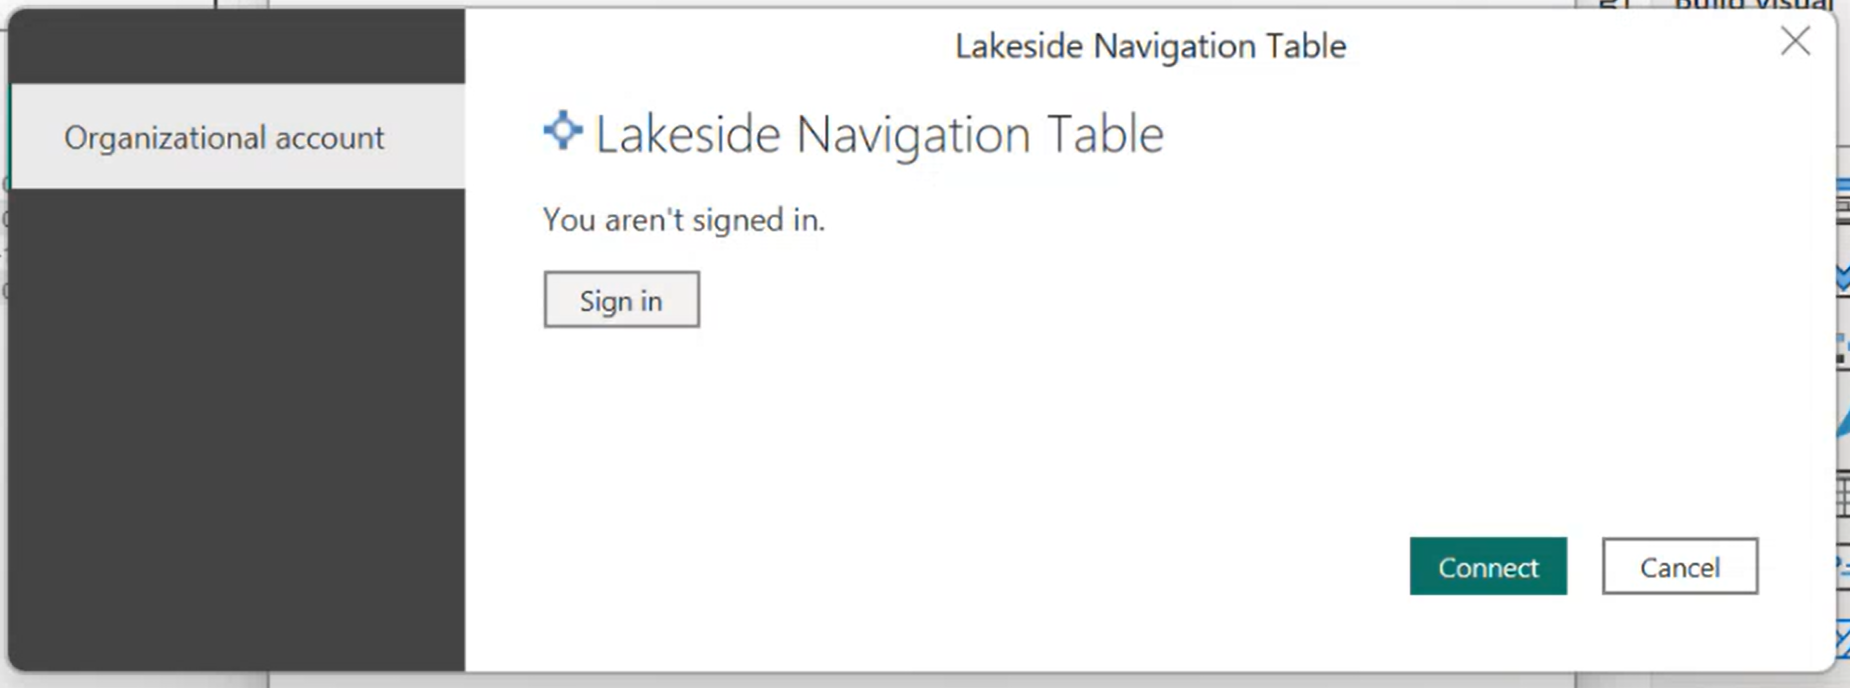
In the Lakeside Navigation Table box that appears, click Sign In.
-
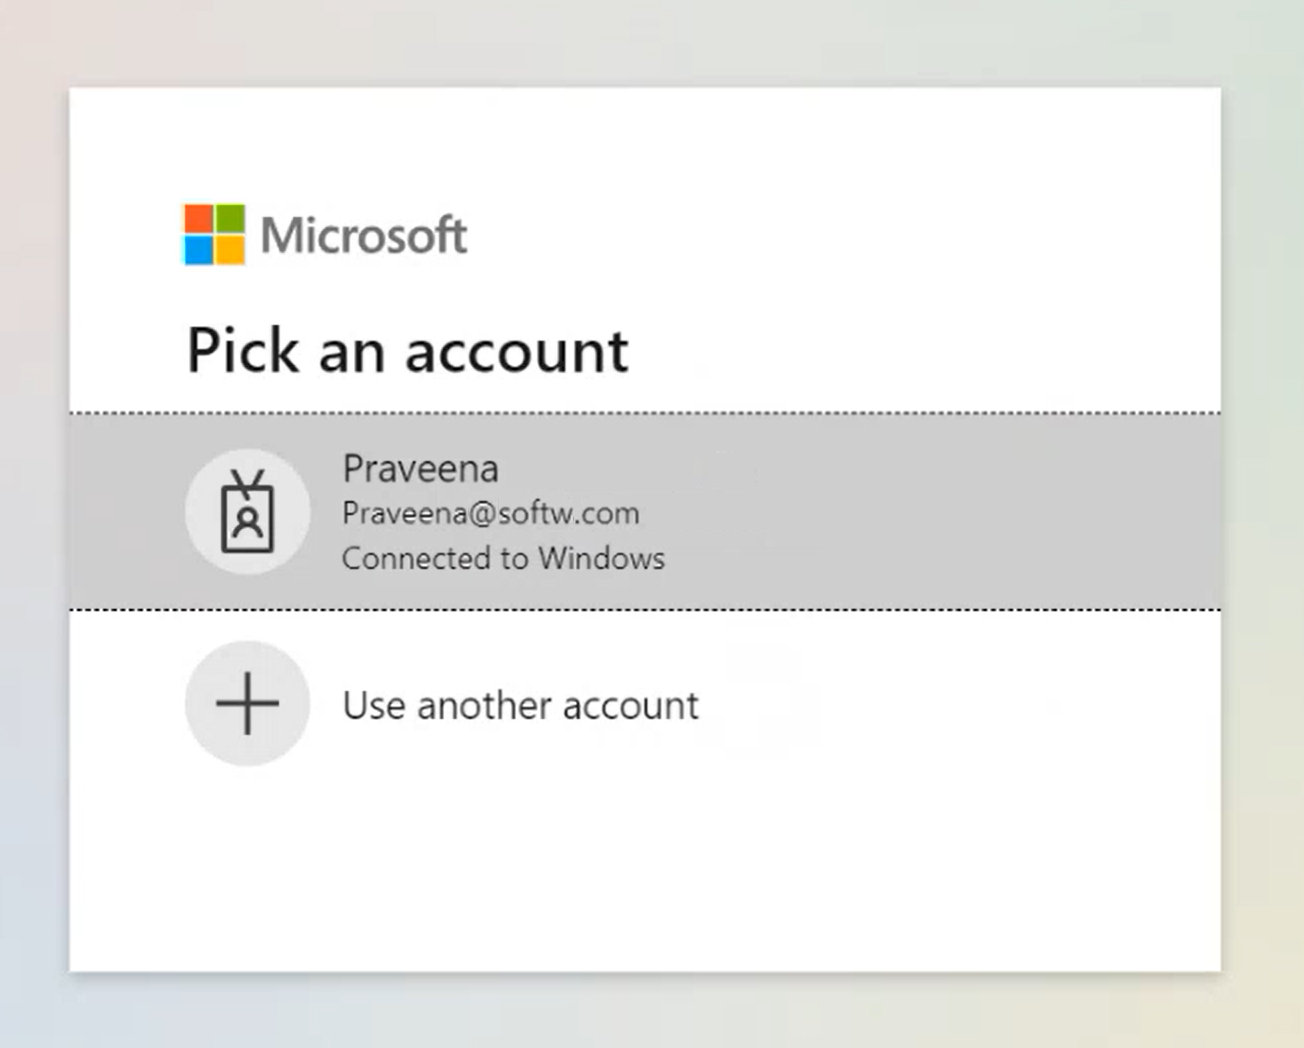
In the Microsoft authentication box that appears, sign in with the Microsoft credentials for your SysTrack account.
-
The Lakeside Navigation Table box reappears. Click Connect.
-
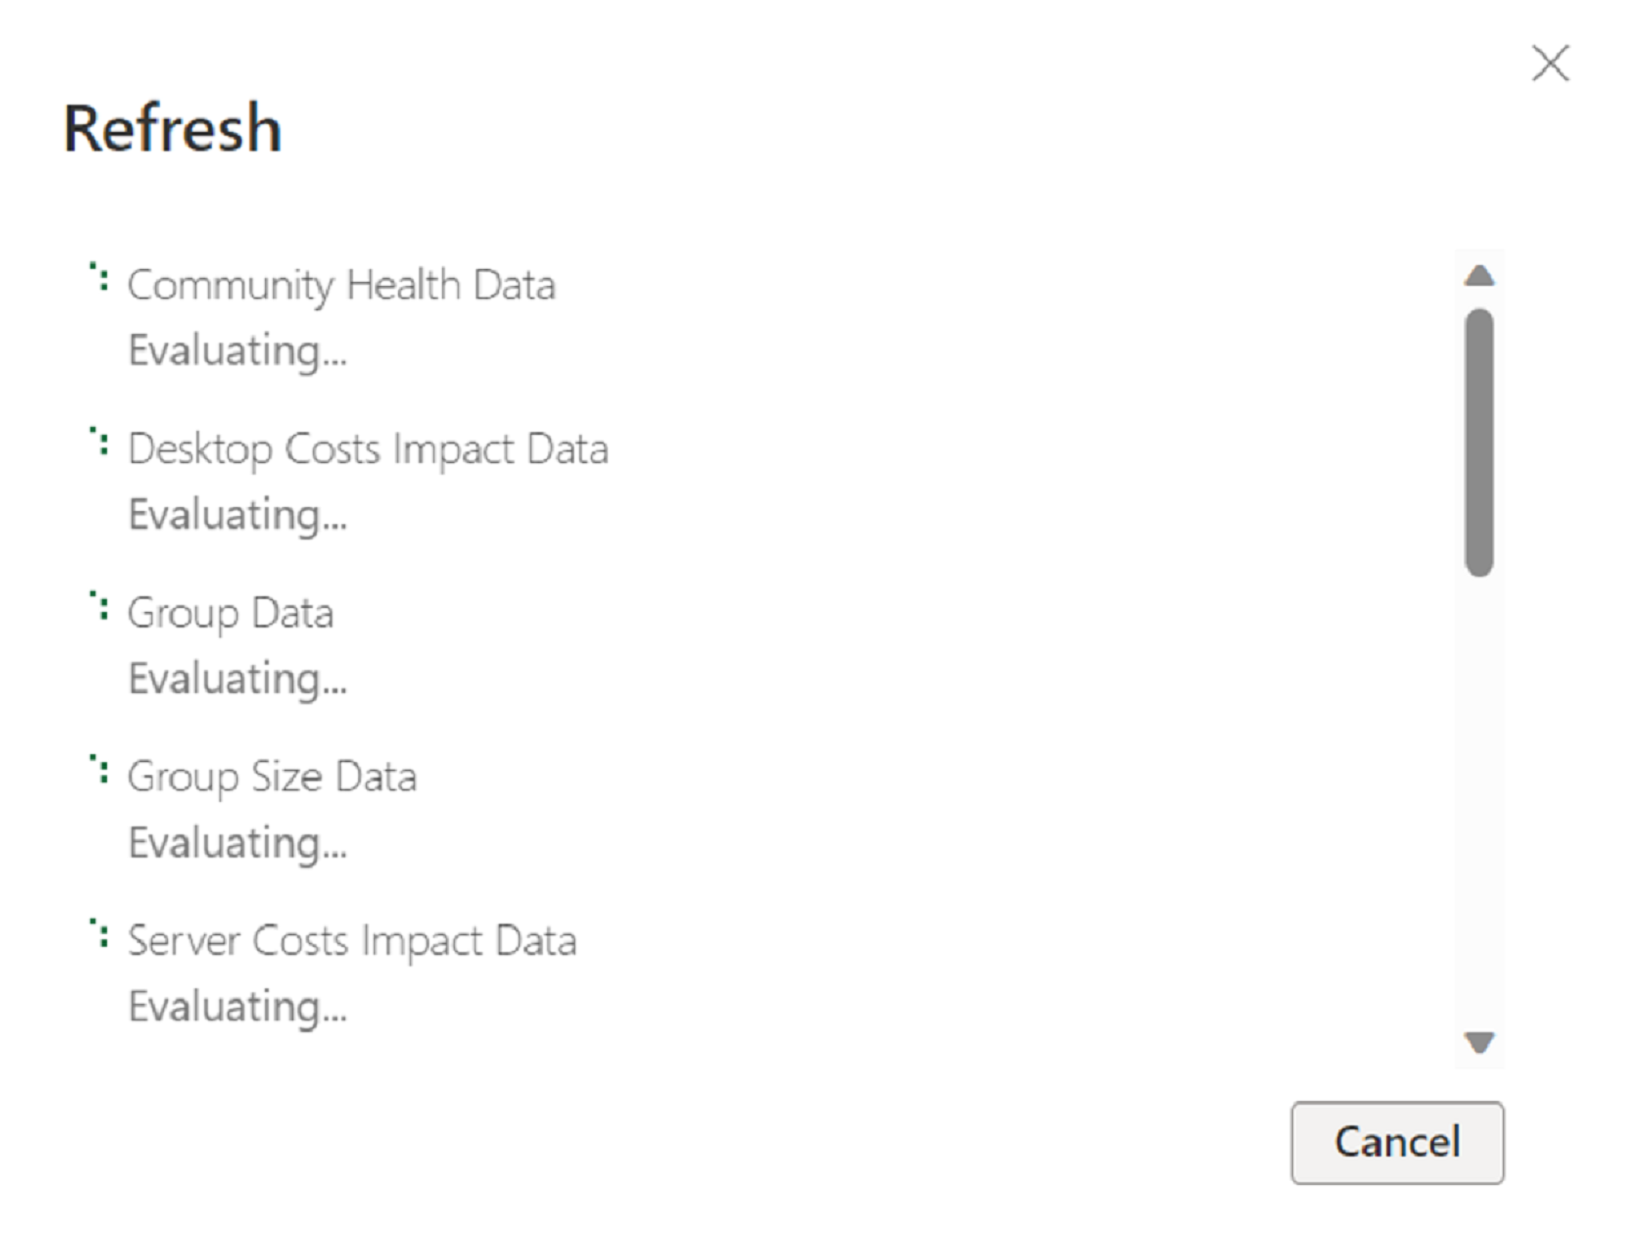
The template uses the credentials you entered to connect to your SysTrack instance. Then it imports your data. While the template is importing your data, a Refresh box includes progress indicators for your import.
NOTE: The initial installation and import of the template can take a few minutes, depending on your connection speed, the size of your tenant, the number of endpoint systems on your tenant, etc. This initial import must build child tables in Power BI based on existing parent tables (created by the connector installation process that you already performed).
-
The Refresh box appears and tells you that some queries are blocked by errors. This is expected behavior that happens during your initial import. You can click Close on the Refresh box.
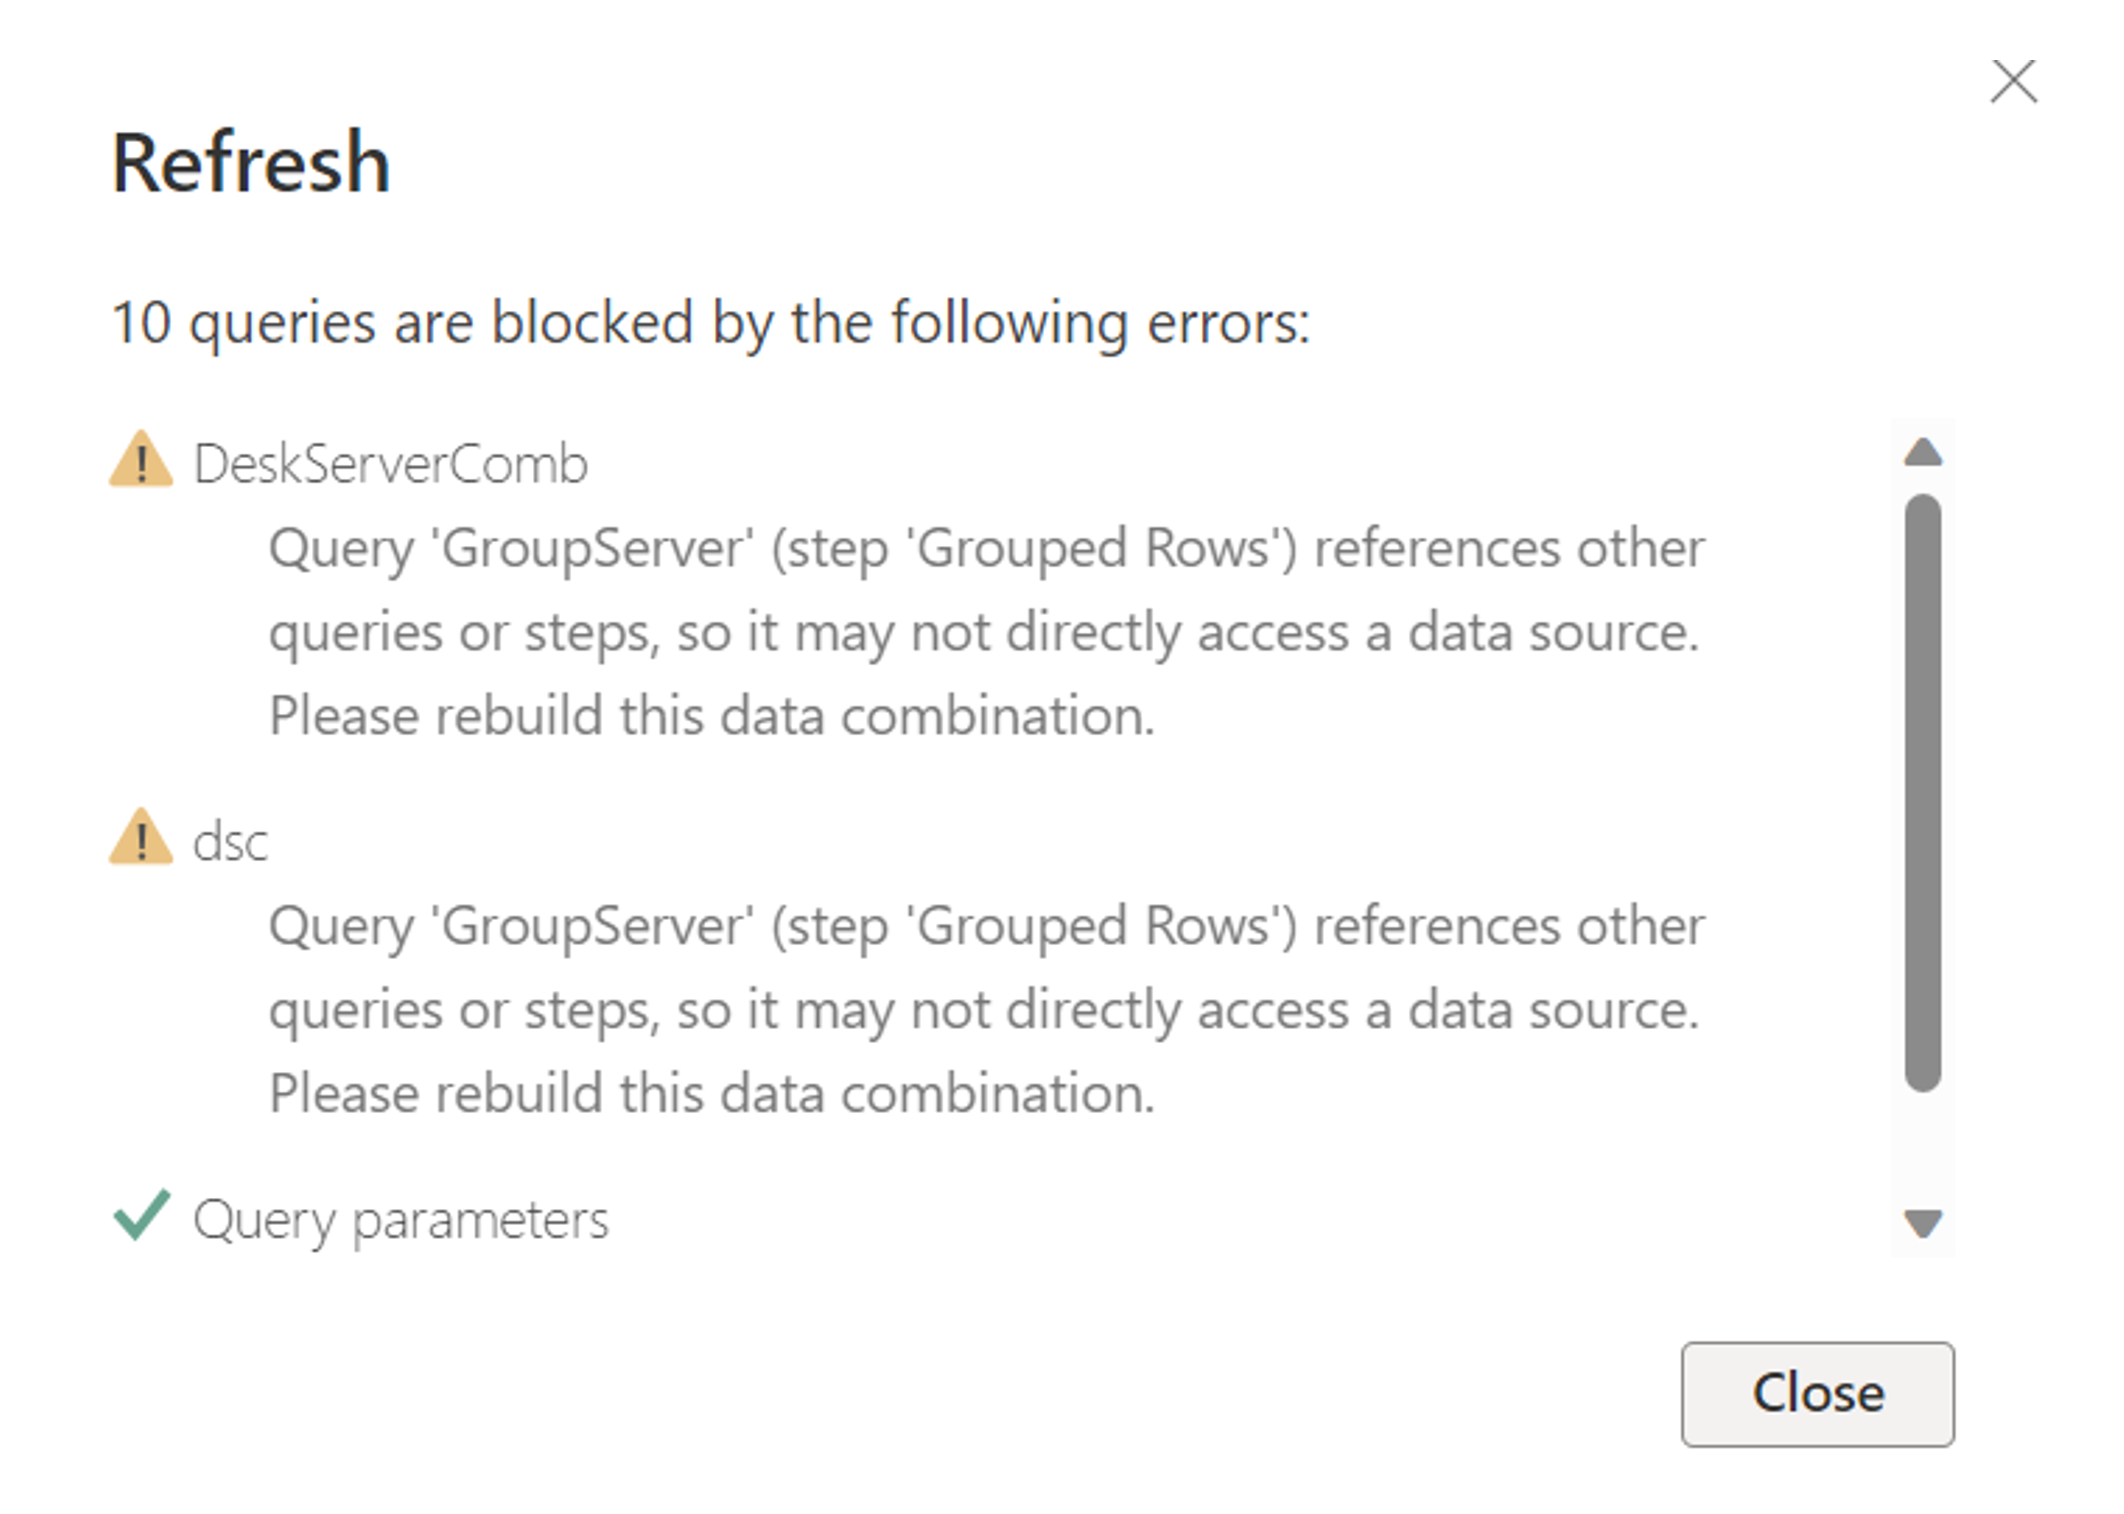
-
The Refresh box closes, and you see a box in which you can apply your changes.

-
Next to There are pending changes in your queries that haven't been applied, click Apply changes. This updates all your child tables with data, and your template is now ready to view.
Read the Template
The Executive Insights template includes three tabs:
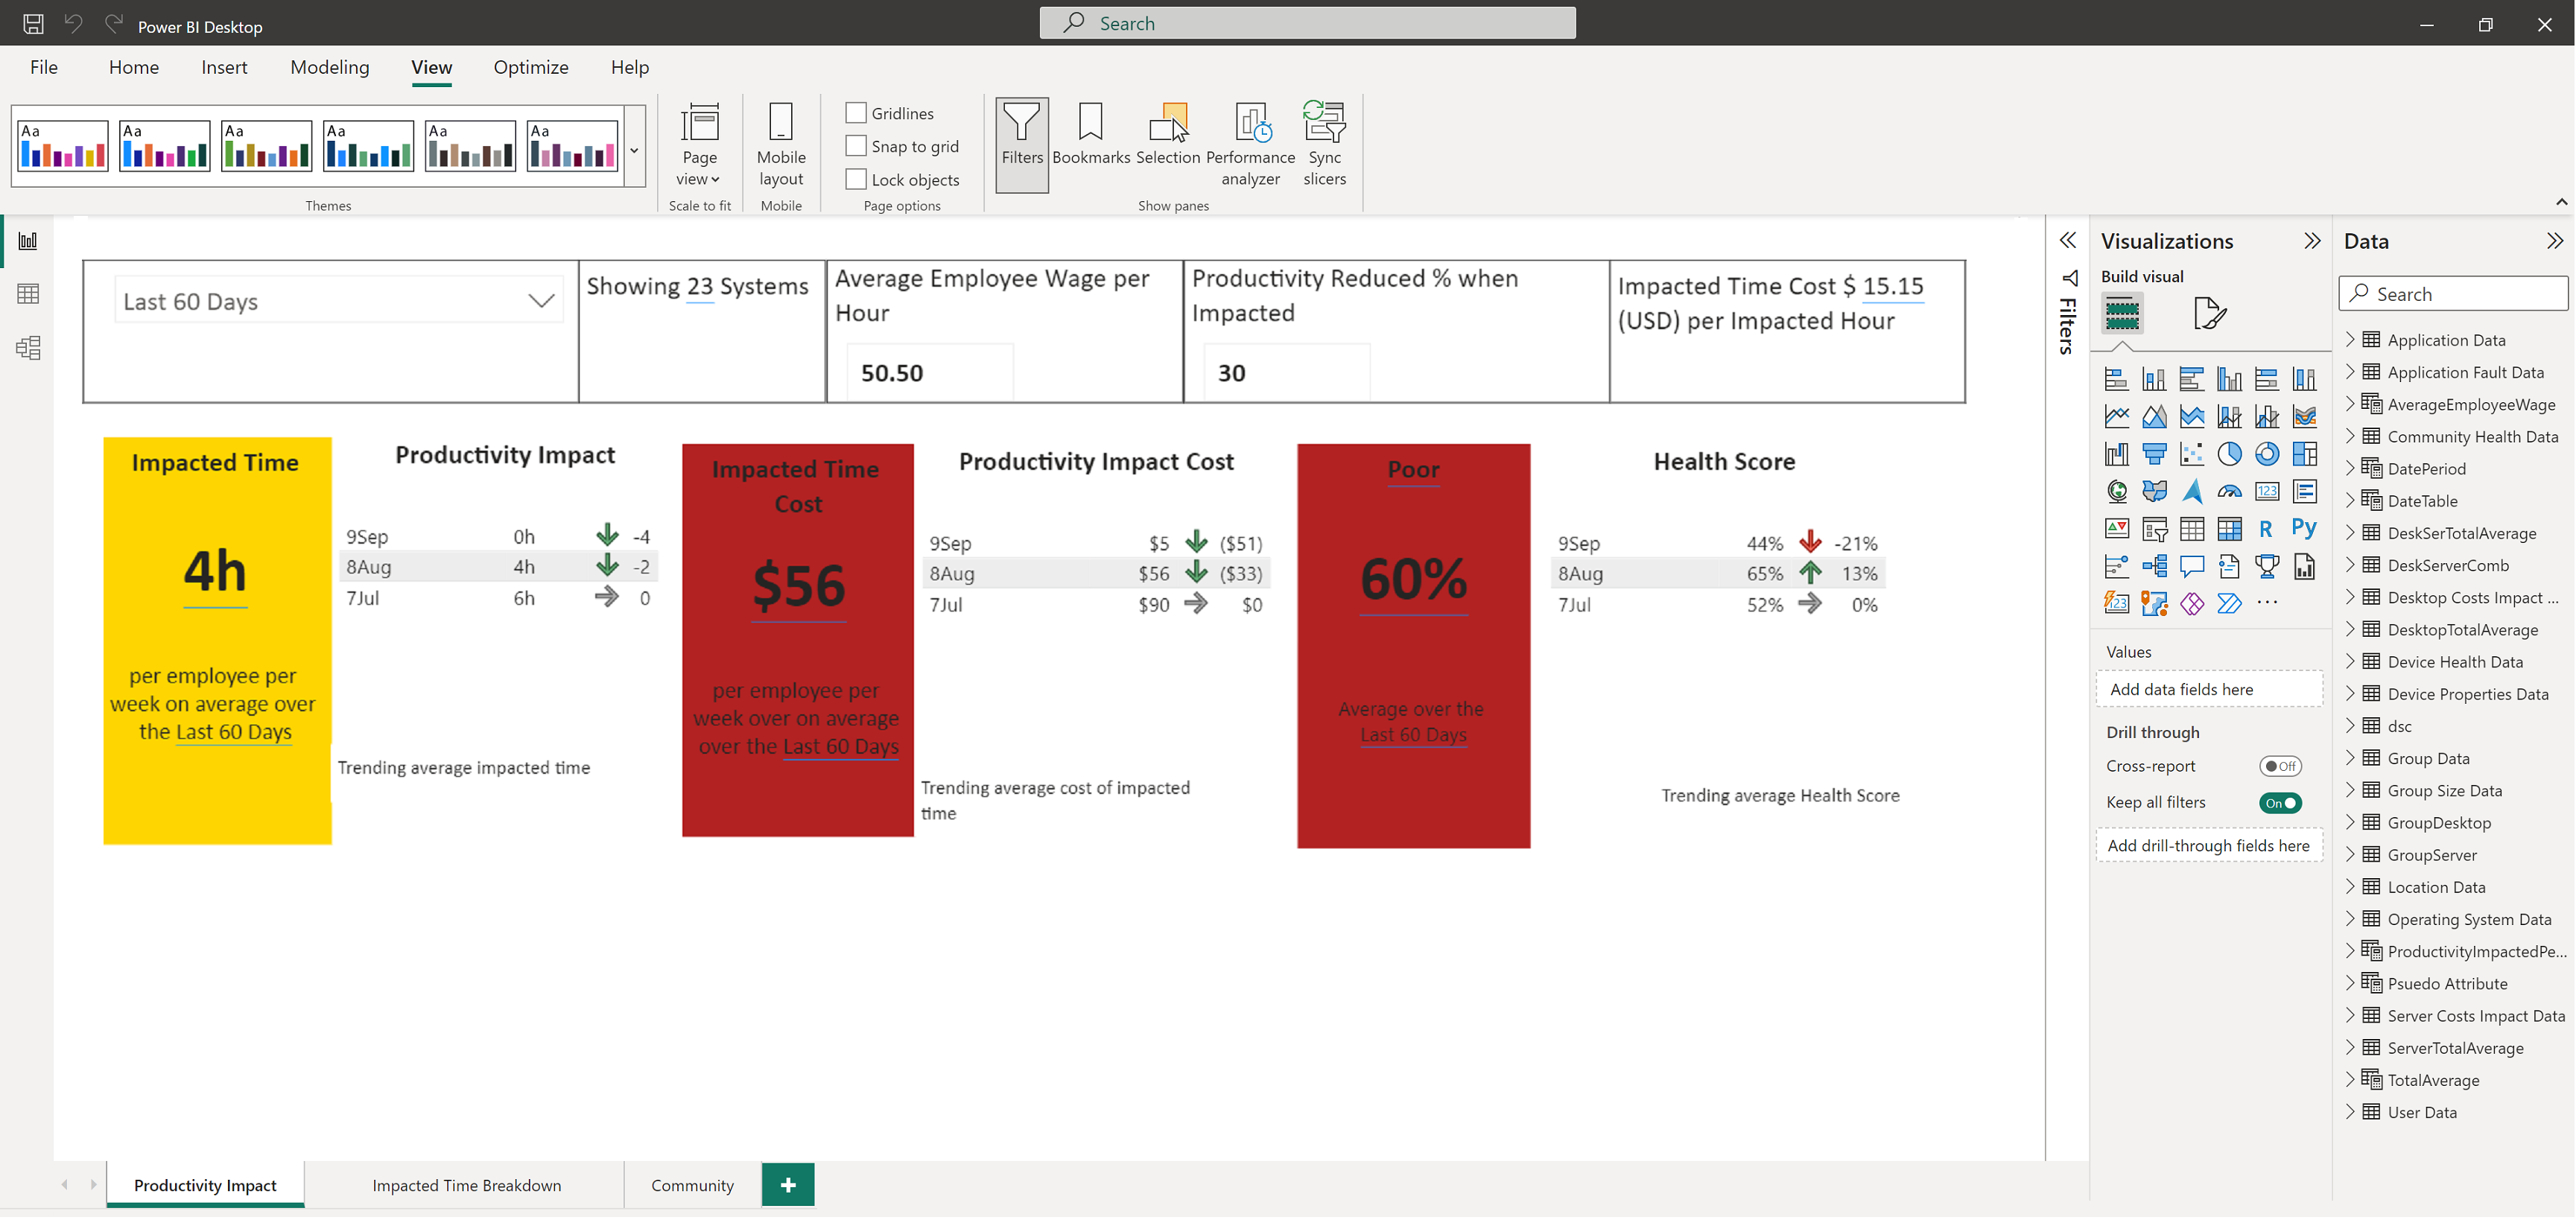
Productivity Impact
The Productivity Impact tab shows three colored dashboard blocks, which display data for Productivity Impact, Productivity Impact Cost, and Health Score.
At the top of the page, the following sections give you settings and information:
-
The time span list enables you to select the time span to display for your data, such as Last 90 days.
-
Showing <number> Systems lets you know how many systems are figured into the data.
-
Average Employee Wage per Hour is a configurable field in which you can add the wage to be used in the cost calculations.
-
Productivity Reduced % when Impacted is a configurable field in which you can enter a value for the percentage of employee productivity lost when IT issues are affecting performance.
-
Impacted Time Cost per Impacted Hour shows you the cost of each impacted hour based on the values you entered in the other fields.
Impacted Time Breakdown
The Impacted Time Breakdown tab shows Distribution and Trending graphs, group data, and a health score breakdown.
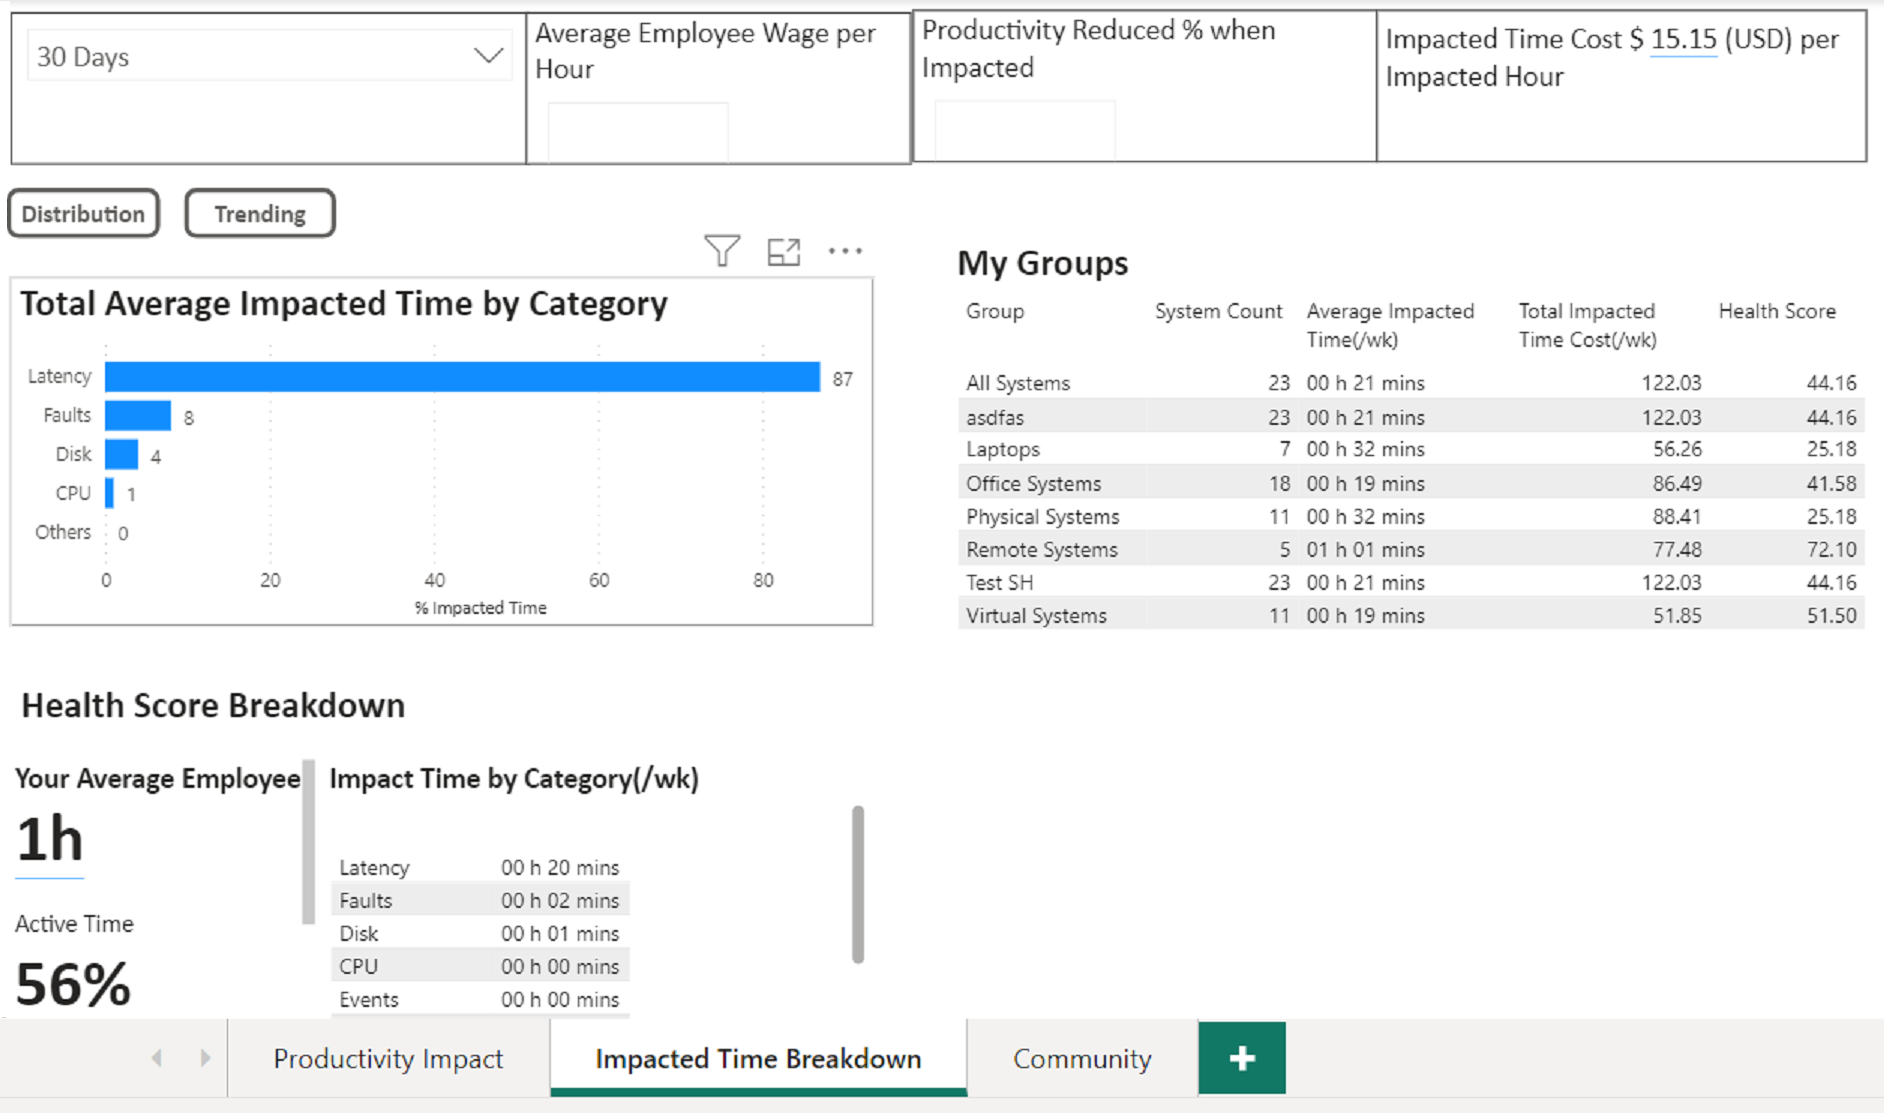
NOTE: When you click the Distribution or Trending buttons to change the charts, this requires pressing Ctrl while clicking the button.
Community
The Community tab shows data and graphs adjusted for Health or for Impacted Time.
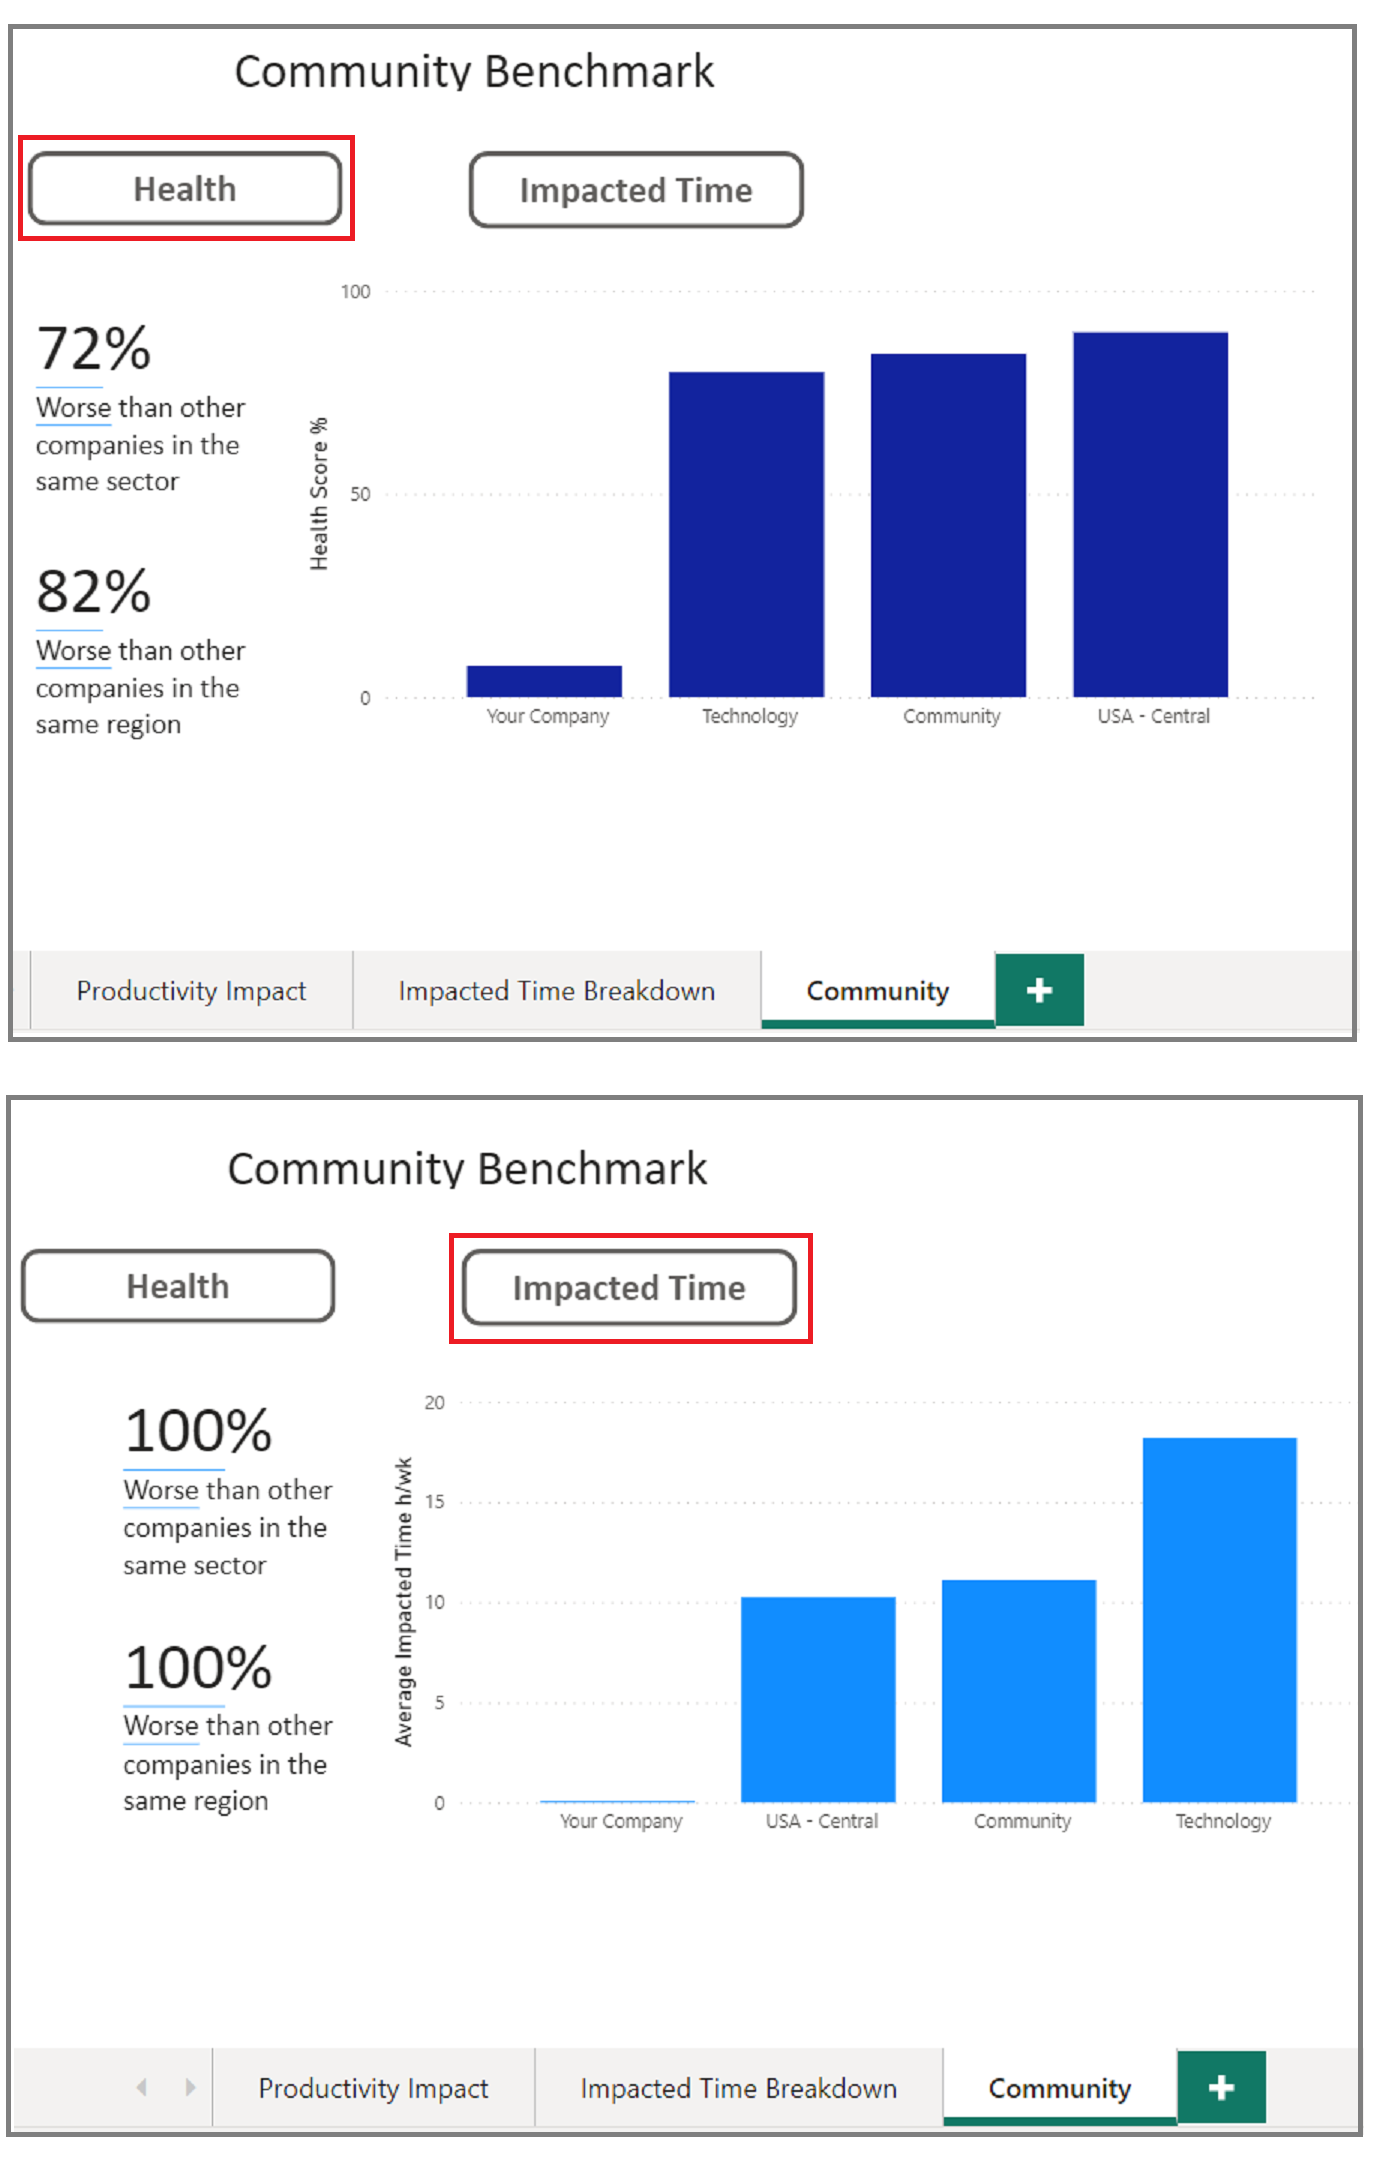
NOTE: When you click the Health or Impacted Time buttons to change the charts, this requires pressing Ctrl while clicking the button.
Datasets Included in the Template
For details about the three datasets included in this template, start here.
More Information on the Data
The Executive Insights template in Power BI is a reproduction of the Executive Insights dashboard in SysTrack. To learn more about the data that appears on both, see:
-
Productivity Impact, Cost, and Health Score for information about blocks and panes.
-
Health Score Details for information about how the health score is calculated.
-
Executive Insights for information about data sources, weighting, filters, and system count.
On This Page