Prevent's Overview Page
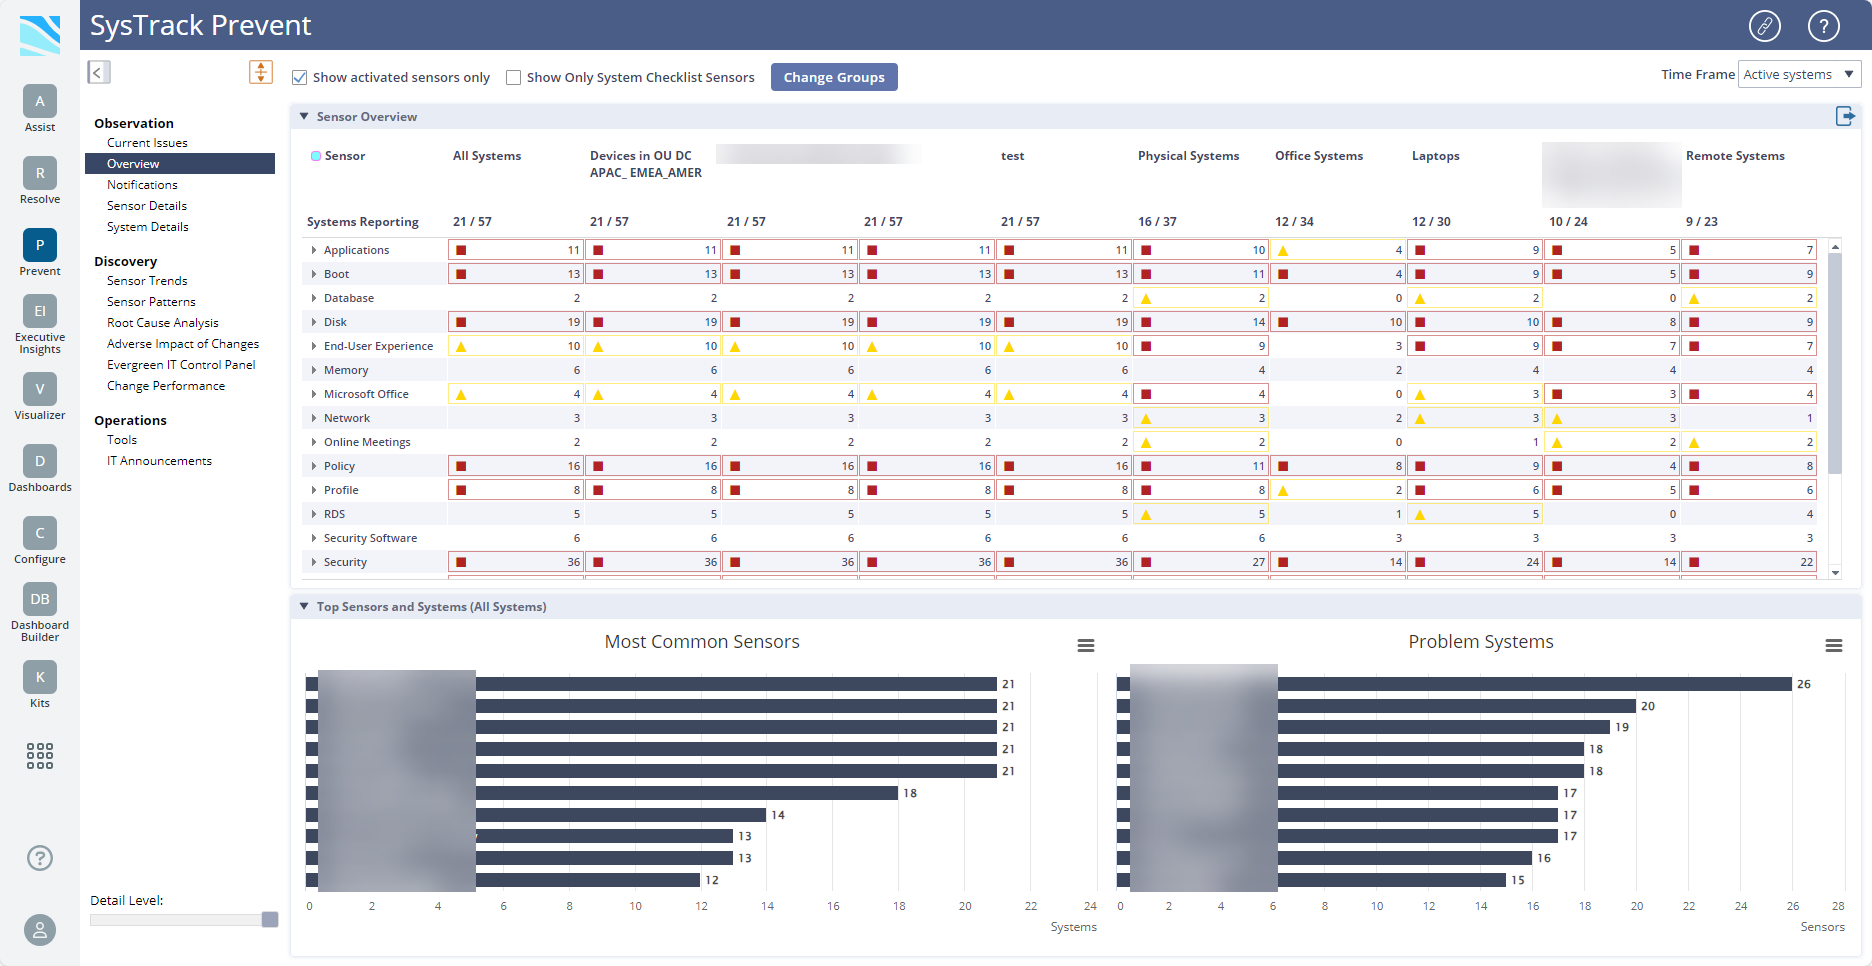
Prevent's Overview page shows you which sensors are broken down by group (in the top grid) and most frequently (in the bottom charts).
- Show activated sensors only shows and hides sensors with zero results and is marked by default. Clear the checkbox to see all the sensors that are being monitored by SysTrack.
- Show Only System Checklist Sensors filters the results to only show System Checklist Sensors. This filter only applies to the Sensor Overview table. These sensors will still show under their Sensor Category.
- Change Groups
- You can use the Time Frame drop-down to see active systems (default) or the latest results for every system, even the systems that are not currently active. This dropdown list only impacts the bottom section, Top Sensors and Systems (All Systems).
Sensor Overview
This table provides an overview of the number of sensors activated, broken down by Sensor Category and Groups. By default, the table will show sensor information for the top 10 largest groups.
Sensor Column
The sensors in the far left Sensor column are listed in collapsible tree format. You can expand the rows to see each individual sensor that was activated in each category.

NOTE: Double-click a sensor to view more information on data for all systems for that sensor on the Sensor Details page.
All Systems Column
The All Systems column shows all systems that are reporting sensor activity.
Group Columns
The other columns are groups as defined in Configure or Deploy.
- Yellow rows indicate that more than five percent of systems have activated sensors.
- Red rows indicate that more than ten percent of systems have activated sensors.
- The sensors are automatically sorted alphabetically. You can click any column header to sort the sensor values from lowest to highest or highest to lowest.
- Double-click any sensor name or double-click in the grid, single click from the most common sensors graph to view more detailed information about that sensor/value on the Sensor Details page. The problem systems graph will take you to system details.

Change Groups
-
Go to Prevent > Overview.
-
Click Change Groups. The System Groups dialog box displays.

-
Select groups that you would like to see or enter text to search for a specific group.
NOTE: You can select up to 10 groups.
-
Click Update Groups. The Overview page updates to display the groups you selected.
Top Sensors and Systems
Most Common Sensors
This graph shows the ten most common sensors in the selected timeframe. If you click a bar in the Most Common Sensors graph, you will arrive on the Sensor Details page for more detail about that sensor.
Problem Systems
This graph shows the ten systems that currently have the most active sensors. If you click a system in the Problem Systems graph, you will arrive on the System Details page for more detail about that system.
On This Page