View the Software Packages Dataset
The Software Packages dataset is available from the Enterprise and Desktop modules. It provides insight into the behavior and use of Software Packages, which are collections of applications. In contrast to Applications, Software Packages are generally purchasable and installable bundles that consume resources when the contained applications are accessed.
Each Software Package in the visualized community is statistically analyzed and presented in this dataset with key performance indicators that may be helpful in planning the IT environment. These statistics help the IT architect to understand the resources demanded by software packages for optimal performance, how the behavior of these software packages may impact the user experience, and usage profile information that helps depict user communities that are made more productive through the use of this software. Each perspective offered is designed to showcase this behavior as it may influence the delivery of IT resources in ways that make people more productive. The displayed data is the average of 90 days by default.
Software Packages Dataset Perspectives
Each dataset is provided with one or more Perspectives. See View Datasets for more information on dataset perspectives and how to customize your perspective display.
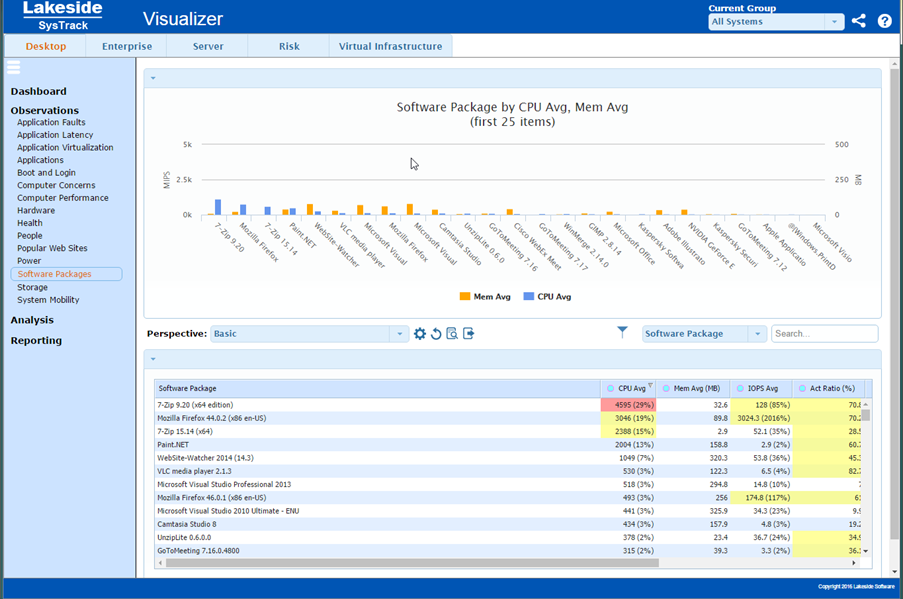
Basic
This perspective delivers a high level view of the software packages used in the visualized community. For each software package, key metrics that indicate the typical, overall resource consumption of the software package along with usage data that helps qualify how it is used are shown.
CPU Technical Analysis
This perspective provides deeper technical data regarding CPU consumption by each software package. Statistical data offered here promotes a finer level of understanding of the processor resource utilization for each software package.
Memory Technical Analysis
This perspective provides deeper technical data regarding memory consumption by each software package. Statistical data offered here promotes a finer level of understanding of the memory resource requirements for each software package.
I/O Technical Analysis
This perspective provides deeper technical data regarding disk I/O consumption by each software package. Statistical data offered here promotes a finer level of understanding of the I/O behavior of each software package.
Usage Summary
This perspective further qualifies how software packages are used in the visualized environment. More detailed data regarding usage patterns may be helpful in planning support for these software packages.
Application Workload Details
Data delivered in this perspective helps to size the overall workload presented by a software package in the visualized environment as operated by the community as a whole. Detailed technical data shown here may be helpful in understanding how a particular software package presents a workload for the computing environment on which it runs.
Named User vs. Per Device licensing
This perspective helps the IT architect to select application licensing modes that are most economically efficient for the visualized environment. Available licensing models vary widely by application, but this perspective helps to contrast the use of software packages by named users versus systems on which the application may be installed.
Configuration Details
This perspective provides an analysis of the GPU and video support requirements, the Microsoft .NET framework requirements, and the Microsoft run time libraries that are required by each software package.
Unused Software
This perspective provides an analysis of software packages that are installed on systems, but are potentially unused. Different columns reflect the period over which no use has been detected. In most cases, software licensing and maintenance costs can be reduced by minimizing the amount of unused software in the visualized environment.
Usage Detail
This perspective provides details of usage patterns for software packages. Different columns reflect the number of systems on which the software was installed, the number of systems on which the software package was used, the number of user accounts that used the software package, the estimated accuracy of the usage data displayed, and the number of systems by period over which no use has been detected.
Systems Installed vs. Used
This perspective shows how the number of systems installed compares with the number of users of the system for each software package.
Usage Data Accuracy
This perspective shows how the accuracy of the software usage detection algorithm varies with the number of installed systems for each software package.
Unused Software: 30 Days
This perspective shows how the number of instances of the software package that have been unused for the past 30 days compares with the total number of installations of the software package.
Unused Software: 60 Days
This perspective shows how the number of instances of the software package that have been unused for the past 60 days compares with the total number of installations of the software package.
Unused Software: 90 Days
This perspective shows how the number of instances of the software package that have been unused for the past 90 days compares with the total number of installations of the software package.
Software Package CPU/MEM Usage
Software packages that consume the most resources when in use have the greatest impact to the IT infrastructure overall (especially when virtualized). These applications require the greatest amount of CPU and memory resources.
Software Package Disk/SAN Usage
Software packages that produce the most data can be found on the far right of this graph. Those near the top are those that consume the most data. Software Packages found in the upper left are those that may benefit the most from SAN implementation for the data storage. These packages will benefit greatly from IO read cached appliances because the applications are most likely to be reading similar data across the enterprise.
On This Page