View the Health Dataset
The Health dataset provides an indication of the quality of service delivered to users in the visualized environment. Information in this dataset indicates the amount of productivity lost due to various classes of problems that may occur on groups of computer systems. An understanding of the quantity of lost productivity and the underlying causes is often helpful in focusing remediation efforts on the types of problems that have the greatest impact on the user community.
Each group of systems in the visualized community is analyzed, and the impact of the service quality on user productivity is quantitized. This information may be useful from both a management and operational perspective in improving service quality in the environment.
Health Dataset Perspectives
Each dataset is provided with one or more Perspectives. See View Datasets for more information on dataset perspectives and how to customize your perspective display.
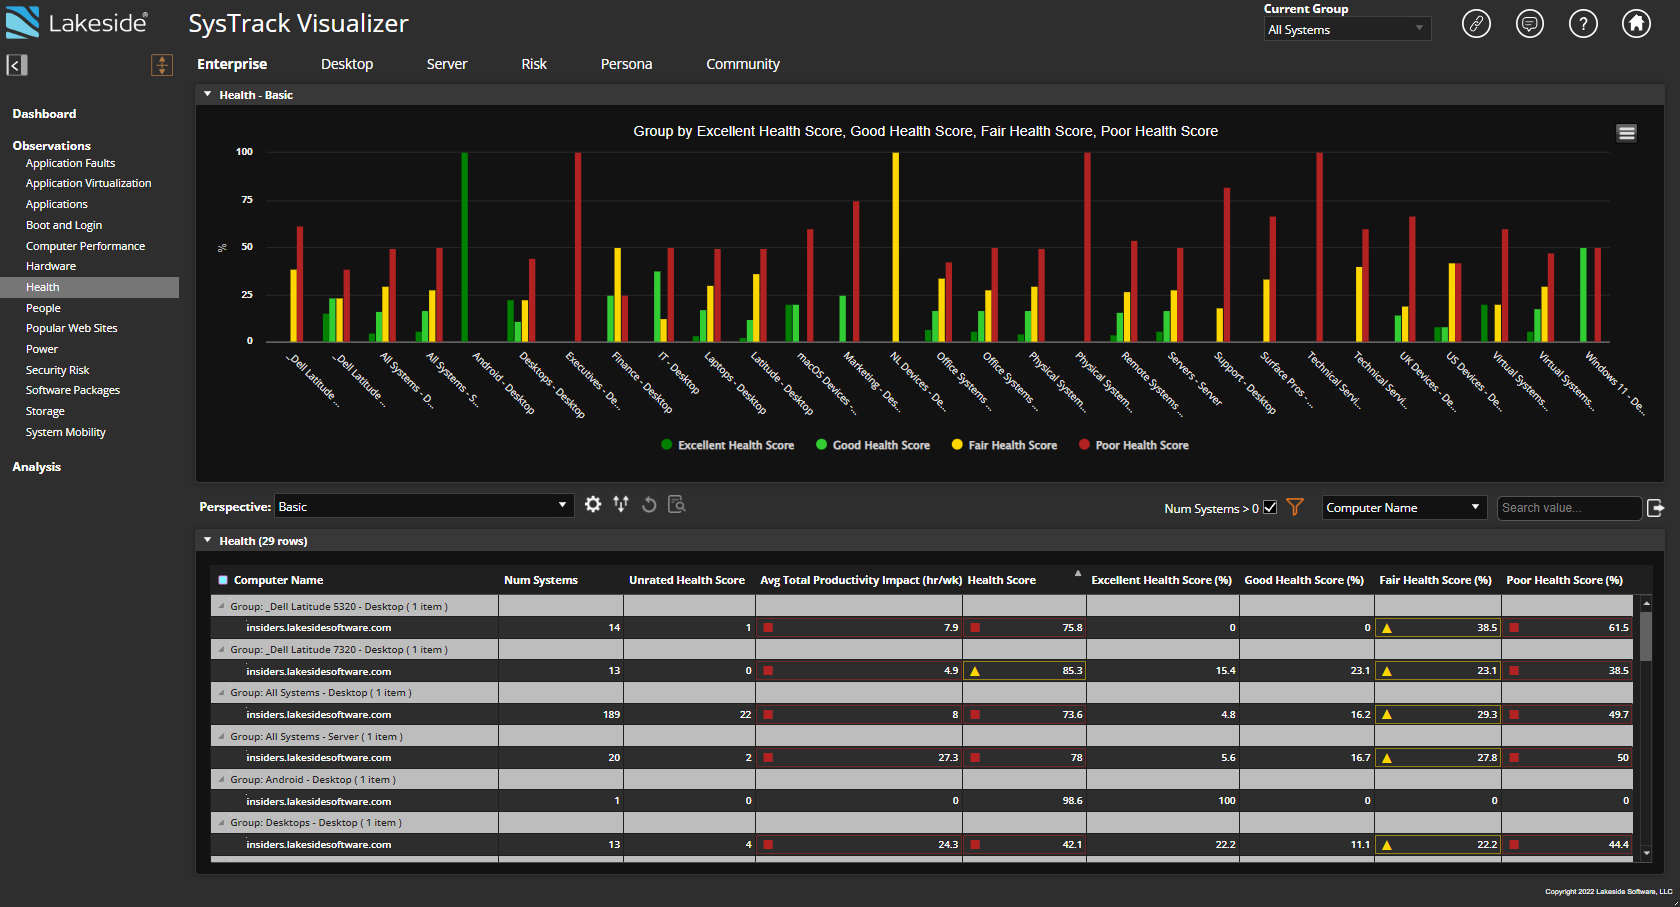
Basic
This perspective provides an overview of the health of collections of systems in the visualized environment, and quantifies the productivity impact on a typical user in the collection of any problems identified. The percentage of users that have an excellent, good, fair, or poor health score is available.
Average Productivity Impact Full Details
This perspective provides the full details regarding the health of groups of systems in the visualized environment, and quantifies the productivity impact of any problems identified. For each type of concern, the impact of the problems on the productivity of a typical user in the group is quantified.
Average Group Impact of Resource Constraints
This perspective provides the details of how resource constraints may impact groups of systems in the visualized environment, and quantifies the productivity impact of any problems identified. For each type of concern, the impact of the problems on the productivity of a typical user in the group is quantified.
Average Group Impact of Configuration Issues
This perspective provides the details of how configuration matters may impact groups of systems in the visualized environment, and quantifies the productivity impact of any problems identified. For each type of concern, the impact of the problems on the productivity of a typical user in the group is quantified.
Average Group Impact of Software Problems
This perspective provides the details of how software problems such as application crashes and hangs and system crashes may impact groups of systems in the visualized environment, and quantifies the productivity impact of any problems identified. For each type of concern, the impact of the problems on the productivity of a typical user in the group is quantified.
Total Group Productivity Impact
This perspective provides an overview of the health of each group of systems as a whole in the visualized environment, and quantifies the productivity impact on the total productivity of all users in the group of any problems identified. The percentage of users that have an excellent, good, fair, or poor health score is available.
Total Productivity Impact Full Details
This perspective provides the full details regarding the health of each group of systems as a whole in the visualized environment, and quantifies the productivity impact of any problems identified. For each type of concern, the impact of the problems on the total productivity of all users in the group is quantified.
Total Group Impact of Resource Constraints
This perspective provides the details of how resource constraints may impact each group of systems as a whole in the visualized environment, and quantifies the productivity impact of any problems identified. For each type of concern, the impact of the problems on the total productivity of all users in the group is quantified.
Total Group Impact of Configuration Issues
This perspective provides the details of how configuration matters may impact each group of systems as a whole in the visualized environment, and quantifies the productivity impact of any problems identified. For each type of concern, the impact of the problems on the total productivity of all users in the group is quantified.
Total Group Impact of Software Problems
This perspective provides the details of how software problems such as application crashes and hangs and system crashes may impact each group of systems as a whole in the visualized environment, and quantifies the productivity impact of any problems identified. For each type of concern, the impact of the problems on the total productivity of all users in the group is quantified.
Quality of Service
Groups found in the upper right of the graph have the best quality of service delivered to the most users in the community. Those found in the lower left would benefit from better service delivery.
On This Page