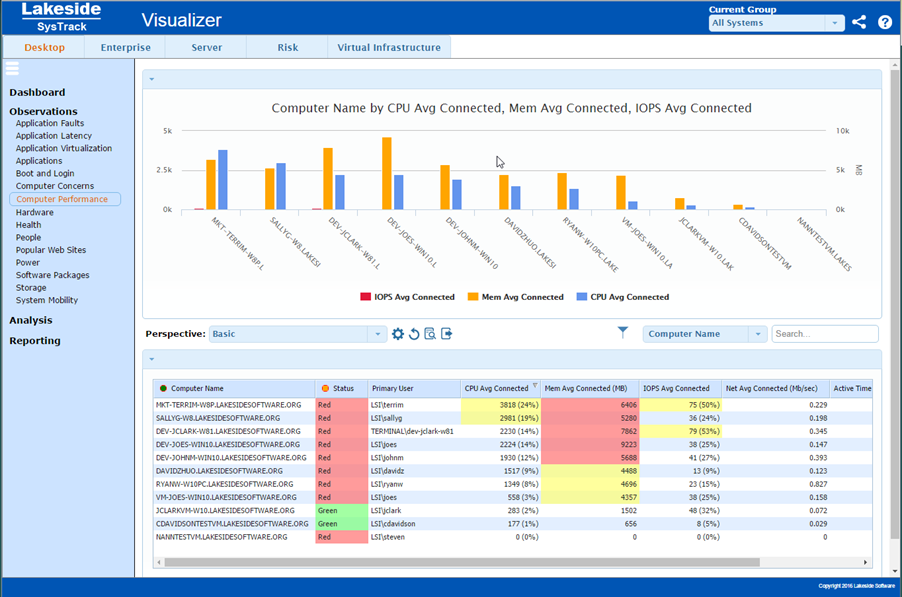
View the Computer Performance Datasets
The Computer Performance dataset is available from the Enterprise and Desktop modules. It provides insight into how computers are used and how much of their available compute resources are effectively used in delivering applications to users. A visualized computer may represent a physical computer or a virtualized computer delivered from a cloud computing environment. Computers are generally used by one or more users, who benefit from the use of the resources and software packages delivered through that computer.
Each computer in the visualized environment is statistically analyzed and presented in this dataset with key performance indicators that may be helpful in planning the IT environment. These statistics help the IT architect to understand the resources available and used, and how well the available resources match the needs of the users of the computer to deliver an optimized environment in the most cost effective way. Each perspective offered is designed to showcase this behavior as it may influence the delivery of IT resources using the least cost model that avoids reducing the productivity of the people that use the computer.

Computer Performance Dataset Perspectives
Each dataset is provided with one or more Perspectives. See View Datasets for more information on dataset perspectives and how to customize your perspective display.
Basic
This perspective offers a high level view of computer performance for systems in the visualized environment. For each system, average resource demand for CPU, memory, I/O, and network are shown. The primary user and typical weekly active time (not including screen saver and display lock) are provided, along with the typical time spent each week in graphically-oriented applications.
CPU Technical Analysis
This perspective offers deeper technical details regarding the use of processor resources on each computer system. Sizing of virtualized desktops is most influenced by average CPU consumed and the standard deviation of the load during login periods, which physical desktops may be best sized using the maximum resource consumption, and standard deviation.
Memory Technical Analysis
This perspective offers deeper technical details regarding the use of memory resources on each computer system. Statistical data such as the maximum and standard deviation of the workload may be helpful in proper and efficient sizing.
I/O Technical Analysis
This perspective offers deeper technical details regarding the use of I/O resources on each computer system. Statistical data such as the maximum and standard deviation of the workload may be helpful in proper and efficient sizing.
Network Technical Analysis
This perspective offers deeper technical details regarding the use of network resources on each computer system. Statistical data such as the maximum and standard deviation of the workload may be helpful in proper and efficient sizing.
Usage by Login and Active Time
This perspective provides more detailed usage data regarding the use of the computer system by the user community. The primary user and typical login (including screen saver and display lock) and active periods are indicated.
Graphics Acceleration Usage
This perspective provides more detailed usage information about how the workload on each computer system leverages GPU acceleration technologies. Data depicted includes the weekly time spent in applications that make use of video acceleration, which is further divided into use by browser applications and non-browser applications.
Browser Usage
This perspective provides detailed usage information about how much time the user community spends in internet browser applications. Browser usage data is divided into graphical and non-graphical usage subsets, and related information about login time, active time, and graphical application time is also made available.
Unused Computers
This perspective identifies computers for which no logins have been detected. If these computers are not used as servers (for which a lack of login activity is normal), they may potentially be unused systems. In most cases, costs can be reduced by minimizing the number of unused computers in the visualized environment.
System Resource Footprint
Systems that consume the most resources have the greatest impact to the IT infrastructure overall (especially when virtualized). These systems (found in the upper right) require the greatest amount of CPU and memory.
On This Page