Define a Data Frame Control
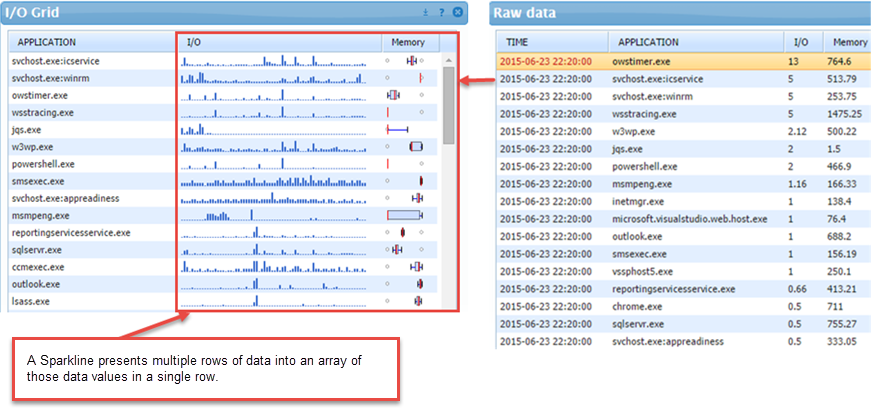
The Data Frame Control is used to transform a single column value from multiple rows into an array of those data values in a single row. This is required for input to a Sparkline visualization. The Data Frame takes the values from the specified Value Column and translates them based on the Frame Column. All other columns are effectively treated as group-by columns.
To prepare the data in a Grid where you want to use a Sparkline visualization, you will usually need to include a Data Frame object between a Query Data control and a Grid block.
- Drag a Query Data block to the workspace and define the Query Data block as necessary.
- Add a Data Frame Control to the workspace and connect a Query Data block as input to the Data Frame Control.
NOTE: The Data Frame Control object will not appear when you view the dashboard.
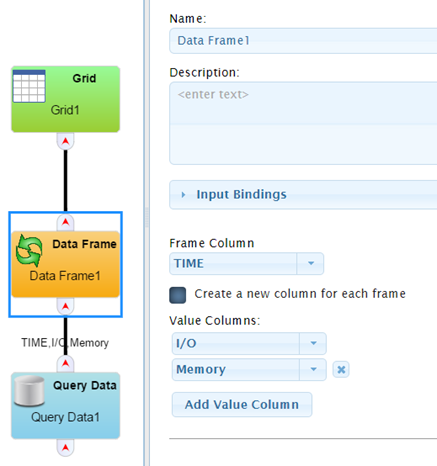
- Select a Frame Column from the drop-down list (the columns are defined in a visualization object, such as the grid in the example above). The Frame Column is the index column around which the data will be transformed. In the example above, this is TIME.
- Specify Value Columns. This is the column whose values will be concatenated. Select the first Value Column from the drop-down list.
- Click the Add Value Column button to select another value column, and repeat this step for each Value Column you wish to add.
- When you are done, click the Apply button.
- Continue with step 4 in Defining a Sparkline.
On This Page