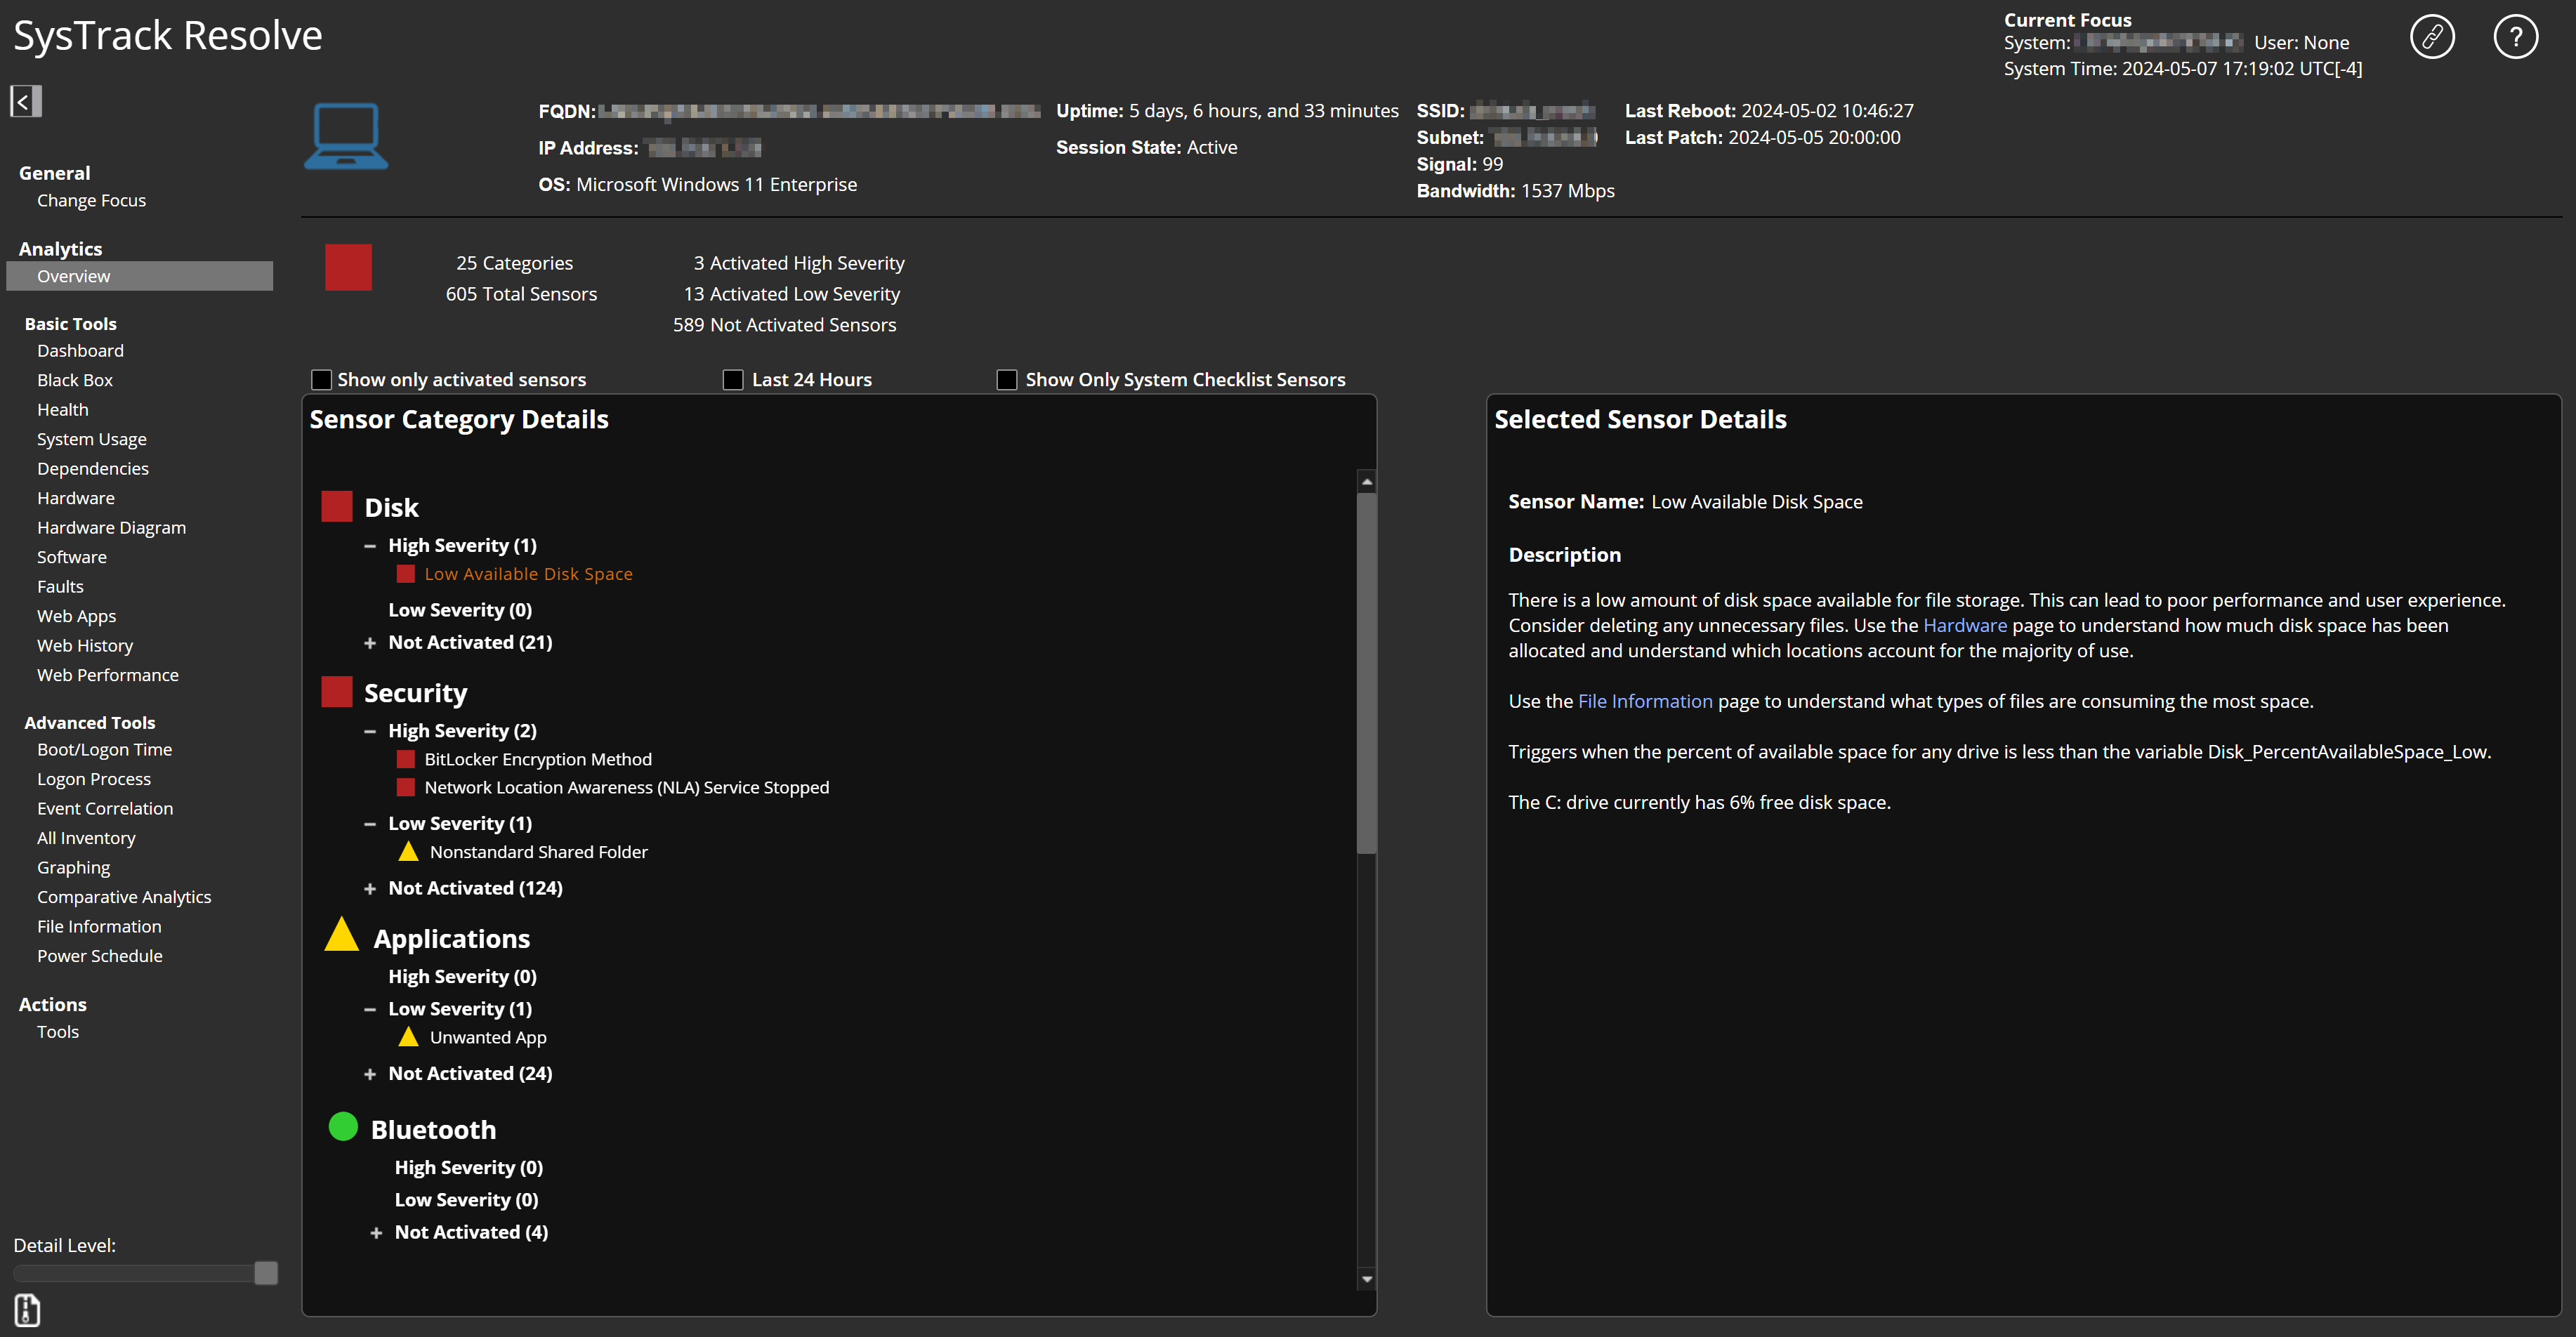
Resolve's Overview Page
After you select a focus system, Resolve connects to that system and executes a system diagnostic routine. Resolve's Overview page opens, displaying the results of the system diagnostics. In some cases, you will want to do further analysis, and you can use other Resolve tools to identify the root cause and find the information you need to resolve the problem.
Basic System Information
The Overview page's top section gives you basic system information, such as the FQDN (fully qualified domain name) and the session state (Active or Inactive). To the left of this information, an image of a laptop, desktop, virtual machine, and so on, gives you a visual indication of the system's chassis or platform type.
Summary of Diagnostic State
Directly under the Basic System Information section of the page, you see a section of summary info about the system's diagnostic state. The icon you see in this section tells you the system's overall state at a glance. The following section explains the meaning of the icons.
Sensor Category Details
The Sensor Category Details section of the page provides quick insight into system issues that have been detected by SysTrack's sensors.
TIP: You configure the sensors and deploy them to the systems with the Deployment Tool or SysTrack Configure. Then your set of sensors runs in the background on the systems.
At the top of this section, three check boxes enable you to filter the results you will see:
-
Show only activated sensors: This check box is checked by default so that only sensor categories that are in the critical state or the warning state appear in the Sensor Category Details. Uncheck this check box to see all sensor results for all categories.
-
Last 24 hours: Check this check box to show only the last 24 hours of sensor results.
-
Show only System Checklist sensors: Check this check box to show sensor results for only the sensors that are in your System Checklist.
To drill down into the information in this section:
-
Click a category that has a plus sign next to it to expand that category.
-
Collapse the category by clicking the minus sign.
-
Click a sensor under Sensor Category Details, and details and recommendations for that sensor appear under Selected Sensor Details on the right.
The icons in the Sensor Category Details section tell you the sensor states for each sensor and for each sensor category.
Show Only System Checklist Sensors
Select Show Only System Checklist Sensors to filter the results to show only System Checklist Sensors. These sensors will still show under their Sensor Category.
NOTE: If the other check boxes are checked, the results will filter accordingly. For example, if you check Show Only System Checklist and Show Only Activated, it will show only system checklist sensors that are activated.

Sensor Icon Definitions
These are the definitions for icons next to individual sensors:
- Green circle means that the sensor passed diagnostic checks.
- Yellow triangle means that the sensor is in a warning state.
- Red square means that the sensor is in a critical state.
Category Icon Definitions
These are the definitions for icons next to sensor categories:
- Green circle appears next to any category in which all sensors have passed diagnostics.
- Yellow triangle appears next to any category in which no sensors have a critical state, and only one sensor is in a warning state.
- Red square appears next to any category in which no sensors have a critical state, but more than one sensor is in a warning state.
- Red square appears next to any category in which one or more sensors are in a critical state.
Summary Icon Definitions
These are the definitions for the icon in the Summary of Diagnostic Information section (above the Sensor Category Details section):
- Green circle appears when all categories have passed diagnostics.
- Yellow triangle appears when only one category is in a warning state.
- Red square appears when no categories are in a critical state, but more than one category is in a warning state.
- Red square appears when one or more categories are in a critical state.
On This Page