Change Performance
You can use this page to assess the performance impact of changes made across many computer systems. You can:
- Select a change in the Common Changes table and view a set of performance metrics on the systems that have that change.
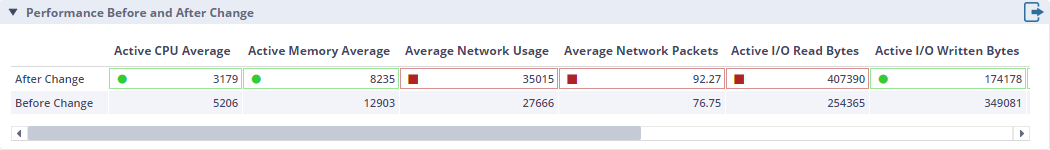
- View the summary metrics in the week before and after the change in the Performance Before and After Change table.
- View the daily average of all systems before and after the change for a selected metric in the Performance Details chart.
Track Changes Across Systems
The SysTrack agent runs on each system being monitored and records changes made to individual systems. You can view these changes in the Common Changes table.
The data is grouped by type, class, and description to give an overall count of the number of monitored systems that had any given change at any point in the past 30 days. You can search for a specific Change or Class in the upper-right search bar.
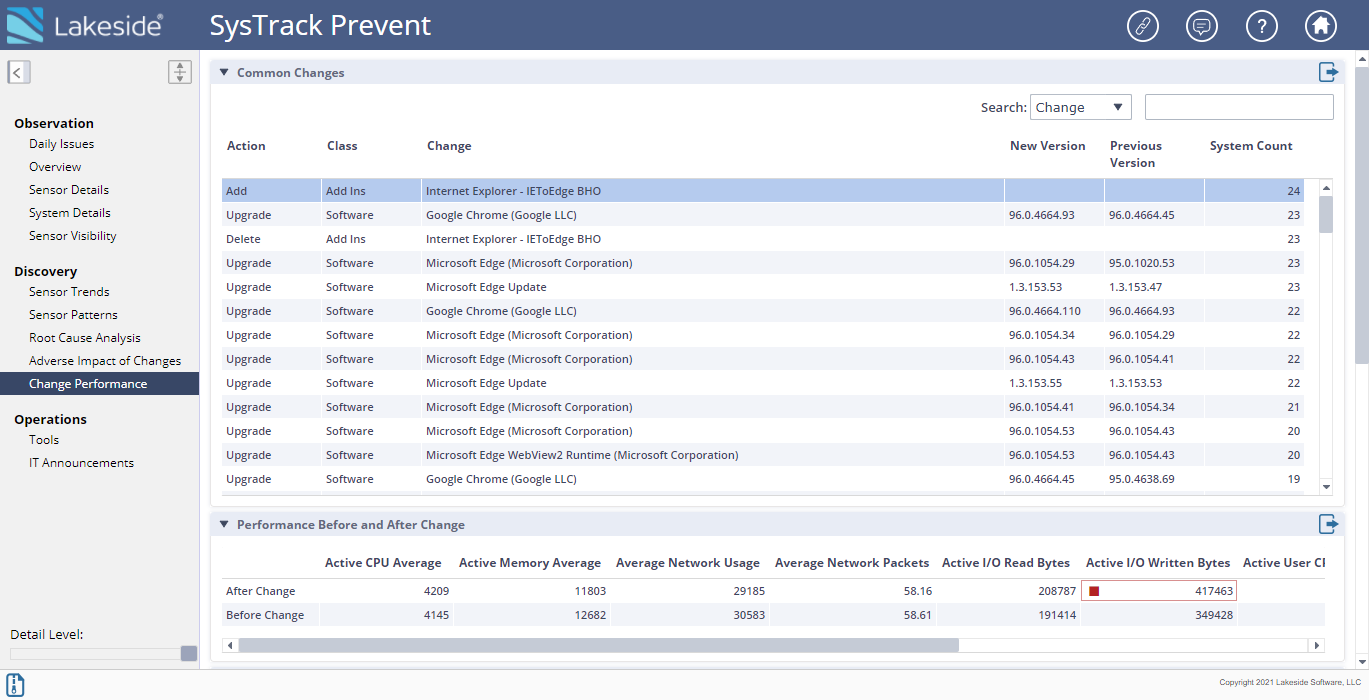
The Change column can include (but is not limited to) the following changes:
- Adding, removing, or updating software packages
- Installing operating system patches
- Adding or removing hardware
- Installing or updating hardware device drivers
- Changing device configuration settings
- Changing security policies or user profiles
- Adding or removing browser add-ins
Calculate Performance Impact for a Selected Change
When you select a change in the Common Changes table, SysTrack takes all the daily performance data for every system that has the selected change and time shifts that performance data so that the day of the change is considered Day 0. The day after the change on each system–which could be a different calendar day for any given system–is considered Day 1, the second day after the change is Day 2, and so on. The first day before the change is considered Day -1, the day before that is Day -2, and so on. In this way, SysTrack can calculate aggregate performance metrics across multiple systems that have a specific change occurring on disparate days.
SysTrack only considers daily performance records for systems that had at least one active user session during the day. If the system is unused on a particular day, the performance record for that day is ignored.
SysTrack calculates a “before” average for each metric on Days -6 through 0, and an “after” average for each metric on Days 0 through +6. This allows a high-level comparison of overall system performance before and after the selected change.
For each individual performance metric, you can investigate the daily trend over the covered period.
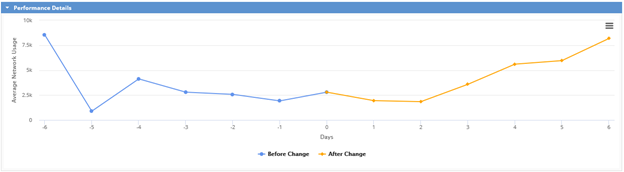
Each daily value in this chart is the average of the performance measurement of every system that many days before or after the change occurred on the system. For example, the chart above could have been created from the data for four individual systems as shown in the following image.
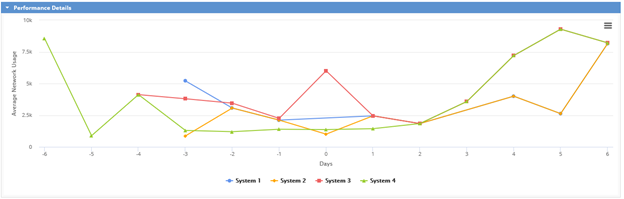
As the above chart shows, not every system will have data for every day before and after the given change. Systems may be off because of work patterns, or a user may not have actively used a system on a given day for any number of reasons. By time shifting and sanitizing missing data, SysTrack provides an accurate view of the true performance impact of a change across an organization.