Home >
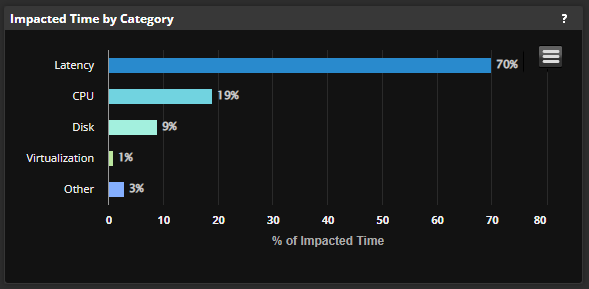
Impacted Time by Category
The Impacted Time by Category chart provides a percentage breakdown of IT issues that affect total impacted time for the selected time period. You can see if system interventions have improved the end-user experience. Use the legend to select and compare multiple groups.

On This Page