Performance System Alarms
The limits (thresholds) used for the System alarms are factory presets that represent baseline testing from manufacturers; however, thresholds should be compared to determined values under real operating conditions found within your enterprise. Using this category on the Roles page Alarms tab, you can adjust yellow and red level alarms for the system performance counters.
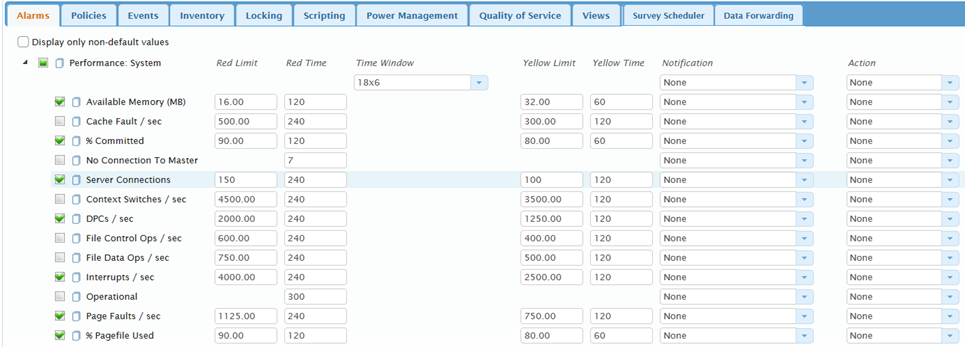
In the example alarm configuration below, if the Cache Fault/ sec is 300 or more for 120 seconds a Yellow level alarm is triggered. If the Interrupts / sec is 500 or more for 240 seconds a Red level alarm is triggered. If either level of alarm is triggered no Notifications will be sent. No Action will be taken for a Red level alarm.
NOTE: An alarm that passes through a Yellow state and achieves a Red state is considered to be in both Yellow and Red alarm status until the condition value is within the limits.
The following table defines each of the system performance alarms.
| System Performance Alarm | Description |
|---|---|
| Available Memory (MB) | Monitors the number of available bytes - this is a measure of free memory. Free memory is the amount of physical memory available to processes running on the system. |
| Cache Fault / sec | Monitors the number of times per second that the Cache Manager fails to find a file's page in the immediate cache. When this occurs, the Cache Manager must ask the Memory Manager to locate the page elsewhere in memory or on the disk so that it can be loaded into the immediate cache. If the page must be brought in from disk, this results in disk activity and a delay to the process that needed the page (while the page is brought in). |
| % Committed | Monitors the size of virtual memory that has been committed (as opposed to simply reserved) as a percentage of the total virtual memory that can be committed without having to extend the paging file(s). Committed memory is physical memory for which space has been reserved on the disk paging files. |
| No Connection To Master | Monitors the connection between the Child System and the Master System. |
| Server Connections | Monitors the number of server session connections. This is an instant count and not averaged over time. |
| Context Switches / sec | Monitors the rate of switches from one thread to another. Thread switches can occur either inside of a single process or across processes. |
| DPCs / sec | Monitors the rate at which deferred procedure calls (DPCs) were added to the processors DPC queues between the timer ticks of the processor clock. DPCs are interrupts that run at a lower priority than standard interrupts. |
| File Control Ops / sec | Monitors the aggregate rate (per second) of all file system operations that are neither a read nor a write. These operations usually include file system control requests or requests for information about device characteristics or status. |
| File Data Ops / sec | Monitors the rate that the system is issuing read and write operations to file system devices. It does not include File Control Operations. |
| Interrupts / sec | Monitors the number of hardware device interrupts that the system is experiencing per second. A device interrupts the microprocessor when it has completed a task or when it requires attention. |
| Operational | The Operational Alarm indicates whether SysTrack Analyze found a new record in the SysTrack system database table for the system being monitored. Under normal (default) conditions, a new record should be found during each sampling interval. |
| Page Faults / sec | Monitors the overall rate (per second) at which faulted pages are handled by the processor. A page fault occurs when a process requires code or data that is not in its working set (its space in physical memory) in main memory. The Page Fault rate includes both hard faults (those that require disk access) and soft faults (where the faulted page is found elsewhere in physical memory). |
| % Pagefile Used | Monitors the percentage of the page file(s) that is/are in use. Paging files are used to store pages of memory used by processes that are not contained in other files when they are swapped out to disk. Pages are swapped out to disk when they are not being used in order to make maximum use of physical memory. |
| Page Input / sec | Monitors the rate (per second) at which pages are read from the disk to resolve memory references to pages that were not in memory at the time of the reference. |
| Page Output / sec | Monitors the rate (per second) at which pages are written to disk to free up space in physical memory. Pages are written back to disk only if they are changed in physical memory, so they are likely to hold data (which is frequently modified by processes), not code (which is usually not modified). A high Page Output rate often indicates a memory shortage. |
| Page Reads / sec | Monitors the rate (per second) at which read operations from disk are initiated to resolve hard page faults. Hard page faults occur when a process requires code or data that is not in its working set or elsewhere in physical memory, and the code or data must be retrieved from disk. |
| Page Writes / sec | Monitors the rate (per second) at which write operations to the disk are initiated to free up space in physical memory. Pages are written to disk only if they are changed while in physical memory, so they are likely to hold data (which is frequently modified by processes), not code (which is usually not modified). |
| % DPC CPU | Monitors the percentage of elapsed time that all processors on the system spend servicing deferred procedure calls (DPCs). The Windows operating system interrupt architecture permits the bulk of the work normally done in an interrupt handler to be handled instead at the DPC level, between interrupt priority and normal application processing priority. |
| % Interrupt CPU | Monitors the percentage of elapsed time that all processors on the system spent handling hardware interrupts. When a hardware device interrupts the microprocessor, the interrupt handler manages the condition, usually by stopping the device from interrupting and scheduling a deferred procedure call (DPC) to service the device. Time spent in DPCs is not counted as time in interrupts. |
| % Total CPU | Monitors the percentage of elapsed time that all the processors on the system are busy executing non-idle threads. On a multiprocessor system, if all processors are always busy, the % Total CPU Time is 100%. It can be viewed as the fraction of the total time spent doing useful work. This value is a good indicator of the demand for and efficiency of a microprocessor. |
| Process Count | Monitors the number of processes in the system at the time of data collection. This is an instantaneous count, not an average over a time interval. Each process represents the running of a program or a service. |
| Processor Queue Length | Monitors the number of threads in the processor queue. |
| Active Sessions | Monitors the number of clients currently connected to a terminal server. This is an instantaneous count and not averaged over time. This counter should not be confused with the number of licenses in use (unless you only have one terminal server). Licenses are based on seats, not sessions. |
| Thread Count | Monitors the number of threads currently active in the process. An instruction is the basic unit of execution in a processor, and a thread is the object that executes instructions. Every running process has at least one thread. |
| % Transition Faults | Monitors the ratio of Transition Faults/sec to Page Faults/sec. The Transition Fault Rate is the rate at which page faults are resolved by recovering pages that were in transition. |
Configure Performance System Alarms
- Select the check box to the left of the Performance: System category to apply the same configuration to the individual alarms.
- To change a Limit, or Timevalue, click the value, then enter the updated value.
- Depending on the alarm, selecting a check box to the left of an alarm, will generate an alarm when the value is either above or below the configured Limit for the specified time period. If this box is unchecked, then the SysTrack Agent will ignore the limit thresholds – no alarm will be generated (although the Agent will still continue to track data for this setting).
- Select a Notification profile to use for the alarm notification settings that will be followed when the alarm is triggered.
- Select a Time Window for the alarm.
- Select an Action profile to use when the alarm is triggered.
- Click the Save Changes button on the top right of the Roles page to save your changes.
On This Page