Performance Disk Alarms
Disk performance counters provide the relative health and performance of the disk. The limit and time settings are average benchmarks from disk manufacturers. However, network administrators will better understand the specific needs and requirements on the disks in the enterprise and on individuals systems. Thus, the limits and times may need to be adjusted to meet the singular reality of a system and a network enterprise. Both logical and primary drives are evaluated.
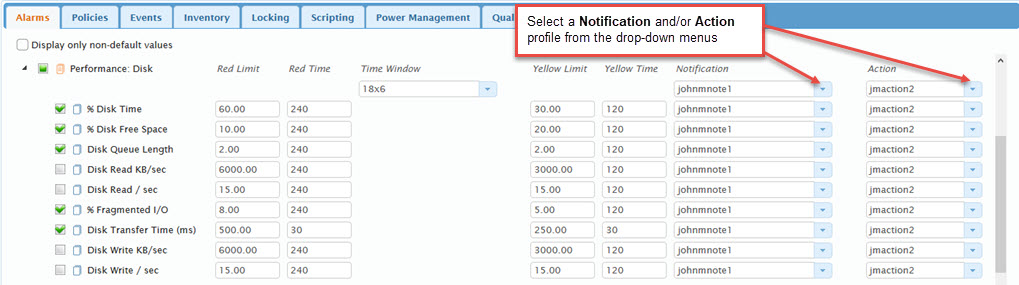
Using this category on the Roles page Alarms tab, you can configure yellow and red level alarms for the disk performance counters.
In the example alarm configuration called out below: If 20% or less of the total usable space on the disk drive is free for a 120 second time period a Yellow level alarm is triggered. If the total usable space is 10% or less for 240 seconds, a Red alarm will be triggered. If either level of alarm is triggered a Notification will be sent. The configured Action will be carried out only if a red level alarm is triggered.
NOTE: An alarm that passes through a Yellow state and achieves a Red state is considered to be in both Yellow and Red alarm status until the condition value is within the limits.
The following table defines each of the disk performance alarms.
| Disk Performance Alarm | Description |
|---|---|
| % Disk Time | Monitors the percentage of elapsed time that the selected disk drive was busy servicing read or write requests. |
| % Disk Free Space | Monitors the percentage of total usable space on the selected logical disk drive that is free. |
| Disk Queue Length | Monitors the current length of the server work queue for this CPU. A sustained queue length greater than four might indicate processor congestion. This is an instantaneous count, not an average over time. |
| Disk Read KB/sec | Monitors the number of bytes per second retrieved from the disk (read). |
| Disk Read / sec | Monitors the rate (per second) of read operations on the disk. Lower is better. |
|
% Fragmented I/O |
Monitors the rate at which I/O requests to the disk are split into multiple requests. A split I/O may result from requesting data in a size that is too large to fit into a single I/O or that the disk is fragmented on single-disk systems. Disks that have a high % Disk I/O Fragmented may need to be defragmented to improve performance. It is important to note that you may have a high % of Disk I/O Fragmentation and yet the defrag utility tells you the drive does not need to be defragmented. The defrag utility calculates fragmented files across the whole volume. There could be a segment of the volume where frequently accessed files are heavily fragmented and impacting performance. A Solid-State Drive (SSD) may display a high % Fragmented I/O with no performance impact. Lower is better. |
| Disk Transfer Time (ms) | Monitors the length of time (in milliseconds) for an average disk transfer. This statistic measures the average time of each data transfer, regardless of the number of bytes read or written. It shows the total time of the read or the write. Average Disk sec/Transfer is usually in multiples of the time it takes for one rotation of the disk. Any variation usually represents time for driver processing or time in the queue. For example, on a 7200-RPM disk, the actual Average Disk sec/Transfer would be in multiples of 8 milliseconds. Lower is better. |
| Disk Write KB/sec | Monitors the number of bytes per second sent to the disk (write). |
| Disk Write / sec | Monitors the rate (per second) of write operations on the disk. Lower is better. |
Configure Performance Disk Alarms
- Select the check box to the left of the Performance: Disk category to apply the same configuration to the individual alarms.
- To change a Limit, or Timevalue, click the value, then enter the updated value.
- Depending on the alarm, selecting a check box to the left of an alarm, will generate an alarm when the value is either above or below the configured Limit for the specified time period. For some alarms, such as % Disk Time, the alarm is triggered if the value is at or above the Limit. For others, such as Disk Transfer Time, the alarm is triggered if the value is at or below the Limit. If this box is unchecked, then the SysTrack Agent will ignore the limit thresholds – no alarm will be generated (although the Agent will still continue to track data for this setting).
- Select a Notification profile to use for the alarm notification settings that will be followed when the alarm is triggered.
- Select a Time Window for the alarm.
- Select an Action profile to use when the alarm is triggered.
On This Page